All 7 results
Sort by
Best selling Microsoft Excel 2019 Data Analysis and Business Modeling notes
 Popular
-
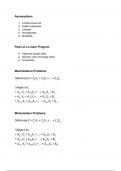
Lecture #8 - Linear Programming
- Class notes • 4 pages • 2024 Popular
- Available in package deal
-
- $8.39
- + learn more
Identify the objective, decision cells, and constraints in an optimization problem. Set up an optimization problem in Excel. Set up Solver to solve an optimization problem in Excel.
 Popular
-
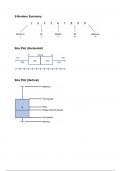
Lecture #5 - Descriptive Statistics Part #2
- Class notes • 5 pages • 2024 Popular
- Available in package deal
-
- $7.59
- + learn more
Construct a box plot to visualize the 5-number of summary of a data set. Match a frequency distribution to a corresponding box plot. Calculate the upper and lower fences for outliers using the interquartile range. Identify outliers using the interquartile range method.
 Popular
-
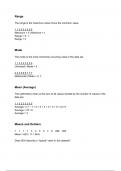
Lecture #4 - Descriptive Statistics Part #1
- Class notes • 5 pages • 2024 Popular
- Available in package deal
-
- $8.09
- + learn more
Explain the measures of central tendency. Calculate the mean, median, and mode of a data set. Calculate the range, quartiles, and interquartile range of a data set. Construct a 5-number summary of a data set.
Do you also write study notes yourself? Put them up for sale and earn every time your document is purchased.

-
Lecture #3 - Data Analysis
- Class notes • 3 pages • 2024 Popular
- Available in package deal
-
- $3.59
- + learn more
Explain the difference between descriptive and inferential statistics. Identify the types of data and levels of measurement. Calculate relative and cumulative frequencies frequencies. Use pivot tables to explore a new data set.

-
Lecture #1 - Introduction to Data Analysis
- Class notes • 2 pages • 2024 Popular
- Available in package deal
-
- $2.99
- + learn more
Distinguish between quantitative and qualitative data. Understand the distinction between different types of statistics and analytics. Explain how data analysis is used to inform business decision-making. Identify the primary steps in the data analysis lifecyle.

-
Lecture #7 - The Normal Distribution
- Class notes • 3 pages • 2024 Popular
- Available in package deal
-
- $5.59
- + learn more
Explain the central limit theorem. Apply the empirical rule to a normal data set. Apply Chebychev's theorem to a non-normal data set. Calculate z-scores for values in a data set. Identify outliers in a data set using z-scores.
Newest Microsoft Excel 2019 Data Analysis and Business Modeling summaries

-
Analytics I: Data Management and Analysis
- Package deal • 8 items • 2024 New
-
- $35.59
- + learn more
Amount of data businesses are able to maintain & process is growing exponentially,& the ability to manage that data successfully can give a business a tremendous competitive advantage; business data landscape, basic data management and analysis skills; data collection, data cleansing and mining, statistical and graphical analysis, basic modeling

 New
New
-
Lecture #5 - Descriptive Statistics Part #2
- Class notes • 5 pages • 2024 New
- Available in package deal
-
- $7.59
- + learn more
Construct a box plot to visualize the 5-number of summary of a data set. Match a frequency distribution to a corresponding box plot. Calculate the upper and lower fences for outliers using the interquartile range. Identify outliers using the interquartile range method.

 New
New
-
Lecture #4 - Descriptive Statistics Part #1
- Class notes • 5 pages • 2024 New
- Available in package deal
-
- $8.09
- + learn more
Explain the measures of central tendency. Calculate the mean, median, and mode of a data set. Calculate the range, quartiles, and interquartile range of a data set. Construct a 5-number summary of a data set.
Do you also write study notes yourself? Put them up for sale and earn every time your document is purchased.


-
Lecture #8 - Linear Programming
- Class notes • 4 pages • 2024 New
- Available in package deal
-
- $8.39
- + learn more
Identify the objective, decision cells, and constraints in an optimization problem. Set up an optimization problem in Excel. Set up Solver to solve an optimization problem in Excel.


-
Lecture #7 - The Normal Distribution
- Class notes • 3 pages • 2024 New
- Available in package deal
-
- $5.59
- + learn more
Explain the central limit theorem. Apply the empirical rule to a normal data set. Apply Chebychev's theorem to a non-normal data set. Calculate z-scores for values in a data set. Identify outliers in a data set using z-scores.


-
Lecture #3 - Data Analysis
- Class notes • 3 pages • 2024 New
- Available in package deal
-
- $3.59
- + learn more
Explain the difference between descriptive and inferential statistics. Identify the types of data and levels of measurement. Calculate relative and cumulative frequencies frequencies. Use pivot tables to explore a new data set.


-
Lecture #1 - Introduction to Data Analysis
- Class notes • 2 pages • 2024 New
- Available in package deal
-
- $2.99
- + learn more
Distinguish between quantitative and qualitative data. Understand the distinction between different types of statistics and analytics. Explain how data analysis is used to inform business decision-making. Identify the primary steps in the data analysis lifecyle.

Study stress? For sellers on Stuvia, these are actually golden times. KA-CHING! Earn from your study notes too and start uploading now. Discover all about earning on Stuvia
