Week 5
Lecture improvement approaches
Tools for analysis
(Re)design
o New start -> ideal situation. Project.
Continuous improvement
o Improving the existing situation. Ongoing-cyclic approach.
o Improvement tools:
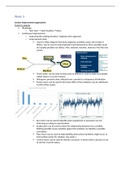
Cause & effect diagram (fish bone diagram): possible causes, the results or
effects. Can be used to systematically track backwards to find a possible cause
of a quality problem (or effect). Man, method, machine, material. Find the root
causes.
Check sheet: can be used to keep track of defects or used to make sure people
collect data in a correct manner.
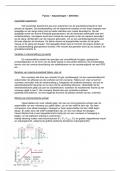
Histogram: presents data collected over a period as a frequency distribution
Pareto chart: can be used to find when 80% of the problems may be attributed
to 20% of the causes.
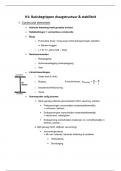
Run chart: can be used to identify when equipment or processes are not
behaving according to specifications
Scatter plot: can be used to show the relationship between two variables.
Plotting possible cause-variables against the problem can identify a possible
correlation.
Flow chart: can be used to help identify points where problems might occur or
intervention points for solution. See week 1.
Control chart: can be used to monitor a process. It shows when a process is out
of control. X and R-values.
,Theory of constraints
Principle: system output is determined by the weakest link. You can only increase the output of a system
when you improve the weakest link.
5 steps:
1. Identify the bottleneck
2. Exploit: get the most out of the constraint
3. Support the constraint -> pace speed of other processes
4. Elevate constraint in the system -> major changes. Buying more machines, hiring more staff.
5. Return to step 1.
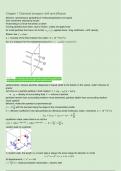
Chain management: drum buffer rope principle. Drum is determining the speed of the process
(=bottleneck). The rope is limiting the others from walking too fast. Buffer is used to deal with the
variation. The rope is limiting the buffer.
Six sigma
Principles: statistical process control, reducing variation. The lower the variation, the higher the control.
It is a project approach: define -> measure -> analyze -> improve -> control -> define -> etc.
Define: clarifying customer requirements, select projects and targets
Measure: define performance indicators CTQ's, design measurements methods, collect data
Analyze: analyze data, identify opportunities for improvement
Improve: develop changes, implement changes
Control: monitoring process performance
Six sigma
Six sigma - statistical process control
, Purpose: determine whether the process is performing as expected. Differentiate between
systematic and random performance variation.
Visualization tools: run charts with control limits: X-chart for averages, R-chart for variation
(highest – lowest value)
The theory of constraints focuses on a specific unit which is identified as the bottleneck unit, but also
includes the search for possible solutions in other units in the chain -> true. Identify the bottleneck, get
the most out of it, defining solutions for the bottleneck using other units (focuses on the chain). Is also
about the drum-buffer-rope-principle.
Lecture improvement approaches
Tools for analysis
(Re)design
o New start -> ideal situation. Project.
Continuous improvement
o Improving the existing situation. Ongoing-cyclic approach.
o Improvement tools:
Cause & effect diagram (fish bone diagram): possible causes, the results or
effects. Can be used to systematically track backwards to find a possible cause
of a quality problem (or effect). Man, method, machine, material. Find the root
causes.
Check sheet: can be used to keep track of defects or used to make sure people
collect data in a correct manner.
Histogram: presents data collected over a period as a frequency distribution
Pareto chart: can be used to find when 80% of the problems may be attributed
to 20% of the causes.
Run chart: can be used to identify when equipment or processes are not
behaving according to specifications
Scatter plot: can be used to show the relationship between two variables.
Plotting possible cause-variables against the problem can identify a possible
correlation.
Flow chart: can be used to help identify points where problems might occur or
intervention points for solution. See week 1.
Control chart: can be used to monitor a process. It shows when a process is out
of control. X and R-values.
,Theory of constraints
Principle: system output is determined by the weakest link. You can only increase the output of a system
when you improve the weakest link.
5 steps:
1. Identify the bottleneck
2. Exploit: get the most out of the constraint
3. Support the constraint -> pace speed of other processes
4. Elevate constraint in the system -> major changes. Buying more machines, hiring more staff.
5. Return to step 1.
Chain management: drum buffer rope principle. Drum is determining the speed of the process
(=bottleneck). The rope is limiting the others from walking too fast. Buffer is used to deal with the
variation. The rope is limiting the buffer.
Six sigma
Principles: statistical process control, reducing variation. The lower the variation, the higher the control.
It is a project approach: define -> measure -> analyze -> improve -> control -> define -> etc.
Define: clarifying customer requirements, select projects and targets
Measure: define performance indicators CTQ's, design measurements methods, collect data
Analyze: analyze data, identify opportunities for improvement
Improve: develop changes, implement changes
Control: monitoring process performance
Six sigma
Six sigma - statistical process control
, Purpose: determine whether the process is performing as expected. Differentiate between
systematic and random performance variation.
Visualization tools: run charts with control limits: X-chart for averages, R-chart for variation
(highest – lowest value)
The theory of constraints focuses on a specific unit which is identified as the bottleneck unit, but also
includes the search for possible solutions in other units in the chain -> true. Identify the bottleneck, get
the most out of it, defining solutions for the bottleneck using other units (focuses on the chain). Is also
about the drum-buffer-rope-principle.