I have made a summary of all the chapters/content we had to learn for the Business Statistics exam. It is an open book exam but studying this still helped me save time during the exam.
2.1 Variables and data
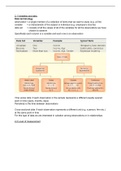
Data terminology
observation = a single member of a collection of items that we want to study (e.g. a firm)
variable = a characteristic of the subject or individual (e.g. employee’s income)
data set = consists of all the values of all of the variables for all the observations we have
chosen to observe
Specifically each column is a variable and each row is an observation
Time series data: if each observation in the sample represents a different equally spaced
point in time (years, months, days)
Periodicity is the time between observations
Cross-sectional data: If each observation represents a different unit (e.g. a person, firm etc.)
at the same point in time
For this type of data we are interested in variation among observations or in relationships.
2.2 Level of measurement
,3.1 Stem-and-leaf displays and dotplots
Stem-and-leaf display
- simple way to visualize small data sets with integers
- tool of exploratory data analysis
Dot Plots
- another simple graphical display of n individual values of numerical data
- it shows variability by displaying the range of data, it shows center by revealing
where the data values tend to cluster and where the midpoint lies.
- can also reveal things about the shape of the distribution if sample is large enough
- a stacked dot plot can be used to compare two or more groups
3.2 Frequency distributions and histograms
Frequency distribution
- a table formed by classifying n data values into k classes called bins. The bin limits
define the values to be included in each bin.
- the table shows the frequency of data values within each bin
- frequencies can be expressed as relative frequencies or in % of the total number of
observations
Histograms
- a graphical representation of a frequency distribution
- column chart whose Y-axis shows the number of data values (or %) within each bin
of a frequency distribution and whose X-axis show the end points of each bin
- shape: suggests the shape of the population we are sampling.
- skewness: indicated by the direction of its longer tail. If neither tail is
longer → symmetric, longer right tail (most business data) → right-skewed
(positive skewed), longer left tail → left-skewed (negatively skewed)
, - outlier: extreme value that is far enough from the majority of the data that it probably
arose from a different cause or is due to measurement error
3.4 Line charts
- used to display a time series, to spot trends, or to compare time periods.
3.5 Column and bar charts
- a column chart is a vertical display of data and a bar chart is a horizontal display of
data
3.6 Pie charts
- because of their visual appeal, pie charts appear daily in company annual reports
3.7 Scatter plots
- shows n pairs of observations (X1, Y2), (X2,Y2), …. (Xn, Yn) as dots (or some other
symbol)
- starting point for bivariate data analysis
- to investigate the relationship between two variables. Typically we would like to know
if there is an association between two variables and if so, what kind of association
- typical scatter plot patterns: strong positive, strong negative, weak positive, weak
negative, no pattern, nonlinear pattern
3.8 Tables
- most simple form of data display
- rows and columns
Chapter 4: Descriptive statistics
4.1 Numerical description of data
- Descriptive measures derived from a sample (n items) are statistics, while for a
population (N items or infinite) are parameters
4.2 Measures of center
, 4.3 Measures of variability
- variation: to describe variation around the center
4.4 Standardized Data
Alle Vorteile der Zusammenfassungen von Stuvia auf einen Blick:
Garantiert gute Qualität durch Reviews
Stuvia Verkäufer haben mehr als 700.000 Zusammenfassungen beurteilt. Deshalb weißt du dass du das beste Dokument kaufst.
Schnell und einfach kaufen
Man bezahlt schnell und einfach mit iDeal, Kreditkarte oder Stuvia-Kredit für die Zusammenfassungen. Man braucht keine Mitgliedschaft.
Konzentration auf den Kern der Sache
Deine Mitstudenten schreiben die Zusammenfassungen. Deshalb enthalten die Zusammenfassungen immer aktuelle, zuverlässige und up-to-date Informationen. Damit kommst du schnell zum Kern der Sache.
Häufig gestellte Fragen
Was bekomme ich, wenn ich dieses Dokument kaufe?
Du erhältst eine PDF-Datei, die sofort nach dem Kauf verfügbar ist. Das gekaufte Dokument ist jederzeit, überall und unbegrenzt über dein Profil zugänglich.
Zufriedenheitsgarantie: Wie funktioniert das?
Unsere Zufriedenheitsgarantie sorgt dafür, dass du immer eine Lernunterlage findest, die zu dir passt. Du füllst ein Formular aus und unser Kundendienstteam kümmert sich um den Rest.
Wem kaufe ich diese Zusammenfassung ab?
Stuvia ist ein Marktplatz, du kaufst dieses Dokument also nicht von uns, sondern vom Verkäufer dishadhesi1. Stuvia erleichtert die Zahlung an den Verkäufer.
Werde ich an ein Abonnement gebunden sein?
Nein, du kaufst diese Zusammenfassung nur für 5,49 €. Du bist nach deinem Kauf an nichts gebunden.