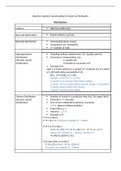
Business Statistics Samenvatting Formules en Methoden
Distributions
Uniform Allemaal zelfde kans
Bernoulli distribution Event is binary ( yes/no)
Binomial distribution Verzameling binary events
Parameters: pie: probability
n = number of trials
Hypergeometric Sampling without replacement. (I.E. Quality control)
Distribution Parameters: N=population size
(discrete valued n=sample size
distribution) s=number of successes in N
Example in R:
Spot 1 or fewer defects in a sample of 7 products out of a batch
of 1,000 with defect probability 0.05.
P(x<_1|N=1000,n=7,s=50)
=phyper (1,50,950,7) = 0.9562
1e getal= P op hoeveel witte ballen pakken
2e getal = hoeveel witte ballen/kapotte dingen in population
3e getal=zwarte ballen/hele dingen
4e getal= hoeveel ballen pakke
Poisson Distribution Number of events in a particular time slot ( No upper limit)
(discrete valued Parameter: λ = intensity
distribution) Sum of two independent poissons is poisson:
λ 1+ λ2 (gewoon labdas optellen)
Expectation μ: λ
Variance σ 2: λ
Example in R:
P of no orders?
P ( X=0|λ=5 )=¿ dpois(0, lambda=5) = 0.0067
P of 4 to 10 orders?
P ( 4 ≤ X ≤ 10|λ=5 )=P ( X ≤10| λ=5 )−P( X ≤ 3∨ λ=5)
=ppois (10, lambda=5) – ppois(3, lambda=5)
=0.9863-0.2650=0.7213
P of more than 12 orders?
P ( X >12|λ=5 )=1−P ( X ≤ 12|λ=5 )
= 1-ppois (12, lambda=5) = 0.0020
, Exponential distribution Waiting times, time until an event happens
(continuous random Parameter: λ
variable) Expected waiting time is 1/ λ
Expectation μ= 1/ λ
Variance σ 2=1/ λ2
Example in R:
Waiting times are exponentially distributed with intensity λ =0.1
What is the probability of having to wait more than 5 minutes?
P ( X >5 ) =1−P( X ≤ 5)
=1-pexp(5, rate=0.1)= 0.6065307
What is the probability of having to wait 6 to 11 minutes?
P ( 6< X <11 )=P ( X <11 )−P( X <6)
=pexp(11,rate=0.1) – pexp(6,rate=0.1)=0.2159406
What is the maximum waiting time with a 99% probability?
P ( X < x )=0.99 = qexp(0.99, rate= 0.1)= 46.0517
Chi-squared ( x 2 ¿ ¿ Waiting times as well
distribution More in testing and statistical sense
Parameter: DF(degrees of freedom) orn
Expectation μ=n
Variance σ 2=2 n
Example in R:
2
P( x ¿ ¿ 6 ≤2.31) ¿
Pchisq(2.31, df=6)=0.1109037
P ( x 6 ≤ x ) =0.90
2
Qchisq(0.90, df=6)=10.64464
F-distribution Used in testing and statistical sense
Parameter: DF1 (degrees of freedom)
DF2
Example in R:
P( F 5,2 ≤ 2.31)
Pf(2.31, df1=5, df2=2)= 0.6708211
P¿
Qf(0.90, df1=5, df2=2)= 9.292
Tekens
Population size N
Sample size n
Population Mean μ
Sample mean x́
Expected value E(X)
2
Population Variance σ
Alle Vorteile der Zusammenfassungen von Stuvia auf einen Blick:
Garantiert gute Qualität durch Reviews
Stuvia Verkäufer haben mehr als 700.000 Zusammenfassungen beurteilt. Deshalb weißt du dass du das beste Dokument kaufst.
Schnell und einfach kaufen
Man bezahlt schnell und einfach mit iDeal, Kreditkarte oder Stuvia-Kredit für die Zusammenfassungen. Man braucht keine Mitgliedschaft.
Konzentration auf den Kern der Sache
Deine Mitstudenten schreiben die Zusammenfassungen. Deshalb enthalten die Zusammenfassungen immer aktuelle, zuverlässige und up-to-date Informationen. Damit kommst du schnell zum Kern der Sache.
Häufig gestellte Fragen
Was bekomme ich, wenn ich dieses Dokument kaufe?
Du erhältst eine PDF-Datei, die sofort nach dem Kauf verfügbar ist. Das gekaufte Dokument ist jederzeit, überall und unbegrenzt über dein Profil zugänglich.
Zufriedenheitsgarantie: Wie funktioniert das?
Unsere Zufriedenheitsgarantie sorgt dafür, dass du immer eine Lernunterlage findest, die zu dir passt. Du füllst ein Formular aus und unser Kundendienstteam kümmert sich um den Rest.
Wem kaufe ich diese Zusammenfassung ab?
Stuvia ist ein Marktplatz, du kaufst dieses Dokument also nicht von uns, sondern vom Verkäufer BramHezemans. Stuvia erleichtert die Zahlung an den Verkäufer.
Werde ich an ein Abonnement gebunden sein?
Nein, du kaufst diese Zusammenfassung nur für 12,99 €. Du bist nach deinem Kauf an nichts gebunden.