Prüfung
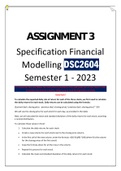
ASSIGNMENT 3 Specification Financial Modelling DSC2604 Semester 1 - 2023 - HowToGuide
- Kurs
- Hochschule
SSIGNMENT 3 Specification Financial Modelling DSC2604 Semester 1 - 2023" is a written set of instructions and guidelines for a financial modeling assignment in the course DSC2604 offered in Semester 1 of 2023. The document outlines the specific requirements and expectations for the assignment, incl...
[ Mehr anzeigen ]