100% Zufriedenheitsgarantie Sofort verfügbar nach Zahlung Sowohl online als auch als PDF Du bist an nichts gebunden
logo-home
Summary Statistics 3 Lectures 7,99 €
In den Einkaufswagen

Zusammenfassung

Summary Statistics 3 Lectures

 1 mal verkauft
  • Kurs
  • Hochschule

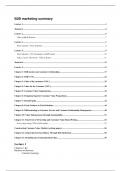
Statistics 3 Lectures LECTURE 1: Recapitulation LECTURE 2: ANOVA / Regression LECTURE 3: Factorial ANOVA LECTURE 4: ANCOVA LECTURE 4: Mediation / Moderation LECTURE 6: MANOVA/ Repeated Measures

vorschau 4 aus 122   Seiten

  • 15. november 2023
  • 122
  • 2022/2023
  • Zusammenfassung
avatar-seller
‭STATISTICS 3 2023‬
‭VRIJE UNIVERSITEIT - BACHELOR PSYCHOLOGY‬
‭WEEK 1‬

‭●‬ ‭LECTURE 1:‬‭Recapitulation‬

‭WEEK 2:‬

‭●‬ ‭LECTURE 2:‬‭ANOVA / Regression‬

‭WEEK 3:‬

‭●‬ ‭LECTURE 3:‬‭Factorial ANOVA‬

‭WEEK 4:‬

‭●‬ ‭LECTURE 4:‬‭ANCOVA‬

‭WEEK 5:‬

‭●‬ ‭LECTURE 4:‬‭Mediation / Moderation‬

‭WEEK 6:‬

‭●‬ ‭LECTURE 6:‬‭MANOVA/ Repeated Measures‬

,‭..‬ ‭Lectures 1: RECAPITULATION‬ ‭WEEK 1‬
‭DEFINITION STATISTICS‬
‭●‬ ‭“‬‭Statistics is the science of collecting, organizing and interpreting numerical facts, which we call data‬‭.”‬
‭●‬ ‭Important‬‭matters for the application of statistics‬‭(“Applied Statistics”):‬
‭1.‬ ‭Selecting a sample‬‭from a population‬
‭a.‬ ‭Random vs non-random selection‬
‭2.‬ ‭Deciding whether a sample is‬‭representative‬
‭a.‬ ‭You want to generalize your findings to the population, not just this sample‬
‭3.‬ ‭Deciding between‬‭Descriptive‬‭or‬‭Inferential Statistics‬
‭4.‬ ‭Measurement levels (NOIR)‬‭and‬‭types of variables (categorical/quantitative)‬
‭5.‬ ‭Selecting the correct‬‭statistical analysis‬
‭6.‬ ‭Experimental‬‭versus‬‭non-experimental‬‭research design‬


‭●‬ ‭A&F: Statistics consists of a‬‭body of methods for obtaining and analyzing data‬‭, to:‬
‭1.‬ ‭Design‬ ‭[research studies that‬‭]‬
‭2.‬ ‭Describe‬ ‭[the data to]‬
‭3.‬ ‭Make inferences‬ ‭based on these data.‬
‭Two types:‬

‭Descriptive Statistics‬ ‭Inferential Statistics‬

‭ escriptive‬ ‭statistics‬ ‭summarize‬ ‭sample‬ ‭or‬ I‭nferential‬ ‭statistics‬ ‭make‬ ‭predictions‬ ‭about‬ ‭population‬
D
‭population‬ ‭data‬ ‭with‬ ‭numbers,‬ ‭tables,‬ ‭and‬ ‭graphs‬ ‭parameters, based on a (random) sample of data‬
‭(e.g., box plots)‬ ‭(Estimate population parameter based upon the sample statistic)‬


‭DATA, POPULATION, SAMPLE, RELIABILITY, VALIDITY‬

‭Doing research by means of‬‭data‬‭: observation of characteristics‬

‭Population‬ T‭ he‬‭total set of participants‬‭, relevant for the‬ E‭ .g.‬‭Population parameter‬‭: average hour of self‬
‭research question‬ ‭study per week of‬‭all‬‭students‬‭.‬

‭Sample‬ a‭ ‬‭subset of the population‬‭about who the‬ E‭ .g.‬‭Sample statistic‬‭: average hour of self study‬‭per‬
‭data is collected‬ ‭week of a randomly selected‬‭sample of‬‭800‬
‭students‬


‭Good data is necessary to answer the research question:‬
‭●‬ ‭Reliability‬‭(Precision => consistency!)‬
‭●‬ ‭Validity‬ ‭(Bias)‬

,‭DESCRIPTIVE STATISTICS‬
‭Variables, measurement levels and range‬
‭Variable‬‭:‬‭measures‬‭characteristics‬‭that can‬‭differ‬‭between subjects‬
‭●‬ ‭Types‬‭:‬‭behavior-, stimulus-, subject-, physiological variables‬‭(eg: reaction time, height, level of aggression)‬
‭●‬ ‭Distribution‬‭:‬‭Summary of one variable‬
‭●‬ ‭Association‬‭:‬‭Summary of Multiple Variables‬


‭Measurement scales‬‭(NOIR):‬

‭N‭o
‬ minal‬ ‭ NORDERED‬‭categories, no ordering, no‬ C
U ‭ ountries‬
‭Categorical‬ ‭meaningful distances, no absolute zero‬ ‭Eye color‬
‭ ategorical /‬
C ‭Biological sex‬
‭Qualitative‬
‭O‭r‬ dinal‬ ‭ RDERED‬‭categories, ordering, no‬
O ‭ ancing Skills categorized as “beginners”,‬
D
‭Categorial‬ ‭meaningful distances, no absolute zero‬ ‭“intermediate”, “advanced”‬
‭ point Likert scale from very satisfied to‬
5
‭very dissatisfied‬
‭disagree/neutral/agree‬

‭I‬‭nterval‬ c‭ ategories, ordering, meaningful‬ T‭ emperature in Celsius (because‬
‭Continuous‬ ‭distances (equal distances between‬ ‭Temperature of 0 does not mean ab‬
‭measures), no absolute zero‬ ‭absence of temperature since there is still‬
‭minus temperatures)‬
‭ uantitative/‬
Q
‭Numerical‬ =‭ equal distance between consecutive‬
(‭ „Parametric‬ ‭values‬
‭Methods“)‬
‭R‬‭atio‬ c‭ ategories, ordering, meaningful‬ ‭ istances between 2 cities; Number of‬
D
‭Continuous‬ ‭distances, an absolute zero‬ ‭Years a person has smoked (0 years is‬
‭absence); Age‬
=‭ equal distance and‬‭true zero point =(‬ ‭Kelvin - Temperature‬
‭absence of the characteristic)‬


‭Range‬‭:‬

‭Discrete‬ ‭measurement unit that is indivisible (1 not 1.2)‬ ‭Example: brothers/sisters‬

‭Continuous‬ ‭infinitely divisible measurement unit‬ ‭Example: body height‬


‭Summarized‬

, ‭Graphs of Descriptive Statistics‬

‭Bar Graph‬ ‭Nominal /Ordinal‬ ‭Bars‬‭apart‬‭from each other‬
‭ isplaying‬
D
‭Frequencies of‬
‭categorical data‬


‭Histogram‬ ‭Interval / Ratio‬ ‭ ars‬‭next to‬‭each other (groups are‬
B
‭ isplaying‬
D ‭connected!)‬
‭Frequencies of‬ ‭ ecause can divide groups into fixes‬
B
‭quantitative data‬ ‭sizes such as income of 1000 - 2000‬


‭Pie Chart‬ ‭Categorical data‬ ‭ isplays the share/ percentage per‬
D
‭Nominal / Ordinal‬ ‭category‬
‭ ot suitable for many values (e.g.,‬
N
‭displaying income of 63 employees)‬
‭Not suitable for continuous data‬


‭Line Graph‬ ‭Interval/ Ratio‬ ‭ sed to show “a trend” of two‬
U
‭variables at a ratio level‬


‭Box Plot‬ ‭ isplays center (= by the median) &‬
D
‭variation of data (= box & lines)‬


‭Scatterplot‬ ‭Interval/ Ratio Level‬ ‭ isplays association / relation‬
D
‭between 2 variables: positive/‬
‭negative‬


‭Difference to Line Graph:‬
‭LG: for trends /SP: for relations‬

S‭ team and‬ ‭Quantitative Data‬
‭Leaf Plots‬

Alle Vorteile der Zusammenfassungen von Stuvia auf einen Blick:

Garantiert gute Qualität durch Reviews

Garantiert gute Qualität durch Reviews

Stuvia Verkäufer haben mehr als 700.000 Zusammenfassungen beurteilt. Deshalb weißt du dass du das beste Dokument kaufst.

Schnell und einfach kaufen

Schnell und einfach kaufen

Man bezahlt schnell und einfach mit iDeal, Kreditkarte oder Stuvia-Kredit für die Zusammenfassungen. Man braucht keine Mitgliedschaft.

Konzentration auf den Kern der Sache

Konzentration auf den Kern der Sache

Deine Mitstudenten schreiben die Zusammenfassungen. Deshalb enthalten die Zusammenfassungen immer aktuelle, zuverlässige und up-to-date Informationen. Damit kommst du schnell zum Kern der Sache.

Häufig gestellte Fragen

Was bekomme ich, wenn ich dieses Dokument kaufe?

Du erhältst eine PDF-Datei, die sofort nach dem Kauf verfügbar ist. Das gekaufte Dokument ist jederzeit, überall und unbegrenzt über dein Profil zugänglich.

Zufriedenheitsgarantie: Wie funktioniert das?

Unsere Zufriedenheitsgarantie sorgt dafür, dass du immer eine Lernunterlage findest, die zu dir passt. Du füllst ein Formular aus und unser Kundendienstteam kümmert sich um den Rest.

Wem kaufe ich diese Zusammenfassung ab?

Stuvia ist ein Marktplatz, du kaufst dieses Dokument also nicht von uns, sondern vom Verkäufer bernarditarichards. Stuvia erleichtert die Zahlung an den Verkäufer.

Werde ich an ein Abonnement gebunden sein?

Nein, du kaufst diese Zusammenfassung nur für 7,99 €. Du bist nach deinem Kauf an nichts gebunden.

Kann man Stuvia trauen?

4.6 Sterne auf Google & Trustpilot (+1000 reviews)

45.681 Zusammenfassungen wurden in den letzten 30 Tagen verkauft

Gegründet 2010, seit 15 Jahren die erste Adresse für Zusammenfassungen

Starte mit dem Verkauf
7,99 €  1x  verkauft
  • (0)
In den Einkaufswagen
Hinzugefügt