Summarising Numerical Data
1. What is the shape of the data
a. Constructing a histogram, we get an initial impression of its shape (symmetric, uniform,
positively / negatively skewed)
2. What is a typical or average value
a. Particular measures (measures of location) need to be used to determine the value
3. How spread out are the data values
a. Measures of Dispersion
Measures of Location
Average / Central Tendency / Typical Value
● Arithmetic Mean / Mean
○ Calculated by “adding up the observed values and dividing it by sample size”
○ When working with a sample of data, it is called the ‘sample mean’ and is denoted by χ
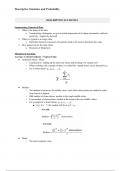
○ For n observations, χ1, χ2, χ3, …, χn:
● Median
○ The median is known as the middle value - seen when observations are ranked in order
from lowest to highest
○ Odd number of observations: median is the single middle value
○ Even number of observations: median is the mean of the two middle values
○ For a sample of n observations, χ1, χ2, χ3, …, χn:
■ E.g. if n = 7, the median will lie at χ8/2 = χ4
● Mode
○ The most common value
, ○ Hardly ever used for continuous data since there are too many distinct values and no
value will stand up over the others
○ There may be no mode or several modes
○ More often used to describe categorical data
When to use Mean or Median
● The shape of the distribution influences the choice on whether to use mean or median - this is the
reason why you should visualise your data
● (Roughly) Symmetric distribution
○ Mean and the Median for exactly symmetric distributions
○ Opt for the mean over the median for roughly symmetrical distributions as the mean is a
more commonly understood measure of average
■ Median dismisses the shape of the data and only takes into consideration the
ranks
● Positive/Negative skew distribution
○ Mean is no longer a valuable measure as it is being affected by extreme values in the data
set
○ Report the median over the mean
● Other shapes
○ Location us not always simple as reporting a single values
○ Always look at the data and decide on the simplest thing to say that reflect reality
Summary: Which Average?
● Mean
○ Wide range of statistical analysis can be used with means
○ Most people understand what it is
○ However, affected by extreme values
● Median
○ Less affected by extreme values
○ Can be used with ordinal data when there are a lot of groups
○ Range of statistical analysis limited when using medians
● Mode
○ There can be more than one mode in a dataset
Measures of Dispersion
Purpose
● Describe variability (dispersion) of the data
● Are the observations similar or spread out
Range
● Simplest measure of spread
● Maximum minus minimum or ‘min to max’
○ E..g. Range = max - min = 40 - 10 = 30
Alle Vorteile der Zusammenfassungen von Stuvia auf einen Blick:
Garantiert gute Qualität durch Reviews
Stuvia Verkäufer haben mehr als 700.000 Zusammenfassungen beurteilt. Deshalb weißt du dass du das beste Dokument kaufst.
Schnell und einfach kaufen
Man bezahlt schnell und einfach mit iDeal, Kreditkarte oder Stuvia-Kredit für die Zusammenfassungen. Man braucht keine Mitgliedschaft.
Konzentration auf den Kern der Sache
Deine Mitstudenten schreiben die Zusammenfassungen. Deshalb enthalten die Zusammenfassungen immer aktuelle, zuverlässige und up-to-date Informationen. Damit kommst du schnell zum Kern der Sache.
Häufig gestellte Fragen
Was bekomme ich, wenn ich dieses Dokument kaufe?
Du erhältst eine PDF-Datei, die sofort nach dem Kauf verfügbar ist. Das gekaufte Dokument ist jederzeit, überall und unbegrenzt über dein Profil zugänglich.
Zufriedenheitsgarantie: Wie funktioniert das?
Unsere Zufriedenheitsgarantie sorgt dafür, dass du immer eine Lernunterlage findest, die zu dir passt. Du füllst ein Formular aus und unser Kundendienstteam kümmert sich um den Rest.
Wem kaufe ich diese Zusammenfassung ab?
Stuvia ist ein Marktplatz, du kaufst dieses Dokument also nicht von uns, sondern vom Verkäufer nicolewoo. Stuvia erleichtert die Zahlung an den Verkäufer.
Werde ich an ein Abonnement gebunden sein?
Nein, du kaufst diese Zusammenfassung nur für 4,90 €. Du bist nach deinem Kauf an nichts gebunden.