Why do we use ‘Tables and Graphical Summaries’?
● Explore data
○ To start understanding the data
○ To find unusual observations/measurements, and errors: identify potential outliers
○ To start to see trends and patterns in data
● Present data
○ To aid decision making
○ To communicate outcomes in a simple and meaningful manner to clients, customers,
boards, directors, etc.
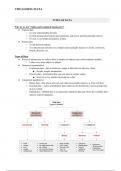
Types of Data
● Pieces of information we collect about a sample (of subjects) are called random variables
○ Values vary from subject to subject
● Numerical (quantitative)
○ Continuous data - data is found on a range or data that can take any value
■ Height, weight, temperature
○ Discrete data - information that can only take on certain values
■ Score on a test, number of people in a class
● Categorical (qualitative)
○ Binary data - data whose unit can only take two possible values (e.g. True or False)
○ Nominal data - “name and labelled” data which can be divided into various groups that
do not overlap
○ Ordinal data - Ordinal data is a categorical, statistical data type where the variables have
natural, ordered categories
, IDENTIFYING DATA TYPES
Importance of Identifying Data
● To correctly:
○ present, summarise and analyse the data
Examples to Identify Data
● Example 1: How old were you when you first graduated from university?
○ In theory the respondent could write down his or her age to any degree of accuracy, so
this question would yield continuous data
○ But the reality is that people would simply state a whole number of years, so in practice
we would end up with discrete data
● Example 2: How old were you when you first graduated from university?
Answers: < 21, 21-24, 25-28, 29-32, > 32
○ now we have categorical data and, since the categories are ordered, we can go one step
further and say that it is ordinal
Categorical Data
● When dealing with categorical data, we often use numbers to represent categories or groups
○ Makes it easier to deal with data as it avoids spelling errors and we just have numbers
● Each category is represented by a single number and written in a table - coding
Summarising the raw data
Alle Vorteile der Zusammenfassungen von Stuvia auf einen Blick:
Garantiert gute Qualität durch Reviews
Stuvia Verkäufer haben mehr als 700.000 Zusammenfassungen beurteilt. Deshalb weißt du dass du das beste Dokument kaufst.
Schnell und einfach kaufen
Man bezahlt schnell und einfach mit iDeal, Kreditkarte oder Stuvia-Kredit für die Zusammenfassungen. Man braucht keine Mitgliedschaft.
Konzentration auf den Kern der Sache
Deine Mitstudenten schreiben die Zusammenfassungen. Deshalb enthalten die Zusammenfassungen immer aktuelle, zuverlässige und up-to-date Informationen. Damit kommst du schnell zum Kern der Sache.
Häufig gestellte Fragen
Was bekomme ich, wenn ich dieses Dokument kaufe?
Du erhältst eine PDF-Datei, die sofort nach dem Kauf verfügbar ist. Das gekaufte Dokument ist jederzeit, überall und unbegrenzt über dein Profil zugänglich.
Zufriedenheitsgarantie: Wie funktioniert das?
Unsere Zufriedenheitsgarantie sorgt dafür, dass du immer eine Lernunterlage findest, die zu dir passt. Du füllst ein Formular aus und unser Kundendienstteam kümmert sich um den Rest.
Wem kaufe ich diese Zusammenfassung ab?
Stuvia ist ein Marktplatz, du kaufst dieses Dokument also nicht von uns, sondern vom Verkäufer nicolewoo. Stuvia erleichtert die Zahlung an den Verkäufer.
Werde ich an ein Abonnement gebunden sein?
Nein, du kaufst diese Zusammenfassung nur für 4,90 €. Du bist nach deinem Kauf an nichts gebunden.