Statistical Modelling for Communication Research
Week 1:
Chapter 1: Sampling Distribution
● Statistical inference/inferential statistics: making inferences about the population from
the sample (generalization), through estimation and null hypothesis testing
○ Sample = random (usually)
● Sample statistic: value describing a characteristic of the sample (one outcome score)
○ E.g., how many yellow candies in a sample
○ Also called a random variable
● Sampling space: collection of all possible outcome scores/sample statistics
○ E.g. all possible quantities of yellow candies in a sample
● Sampling distribution: includes the characteristics of different possible samples that
could’ve been drawn from the population
○ All the possible sample statistic values & their probability/ probability density
○ distribution of the outcome scores of many samples
○
■ (it’s not always a normal distribution)
● Cases: the ‘things’ that are being counted→ units of analysis
● To calculate probability of a sample statistic outcome: divide number of samples with
desired outcome (e.g. all samples with 5 yellow candies) by the total number of samples
● Probability distribution: shows the probability of all outcomes in the sampling space
(changes frequency in a sampling distribution to probability)
○ Discrete: when only a limited number of outcomes are possible so you can list the
probability of each outcome separately
● Probablity density: a means of getting the probability that a continuous random variable
(like a sample statistic) falls within a particular range
● Expected value: average (mean) of the sampling distribution of a random variable
○ population proportion x total number of cases in the sample
○ The mean of a probability distribution, e.g a sampling distribution
○ If a sample statistic is an unbiased estimator of a parameter (population value), the
parameter value equals the average of the sampling distribution, which is called
the expected value or expectation
, ● Sample statistic is called an unbiased estimator of the population statistic (proportionally;
the % of yellow candies in a bag can estimate the % of yellow candies in the factory)
● Unbiased estimator: A sample statistic for which the expected value equals the
population value
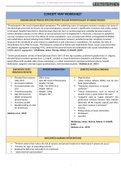
● [The sampling distribution collects a large number of sample proportions. The mean of
the proportions in the sampling distribution (expected value) equals the proportion of
yellow candies in the population, because a sample proportion is an unbiased estimator of
the population proportion.]
● Population statistic AKA parameter
● We say a random sample is in principle representative or representative in the statistical
sense of the population bc it’s not always gonna be a super exact representation of the
population
● Draw 1000s of samples, calculate the mean → get true population value
● Continuous variable: We can always think of a new value in between two values
○ w/ continuous sample statistics, look at range of values
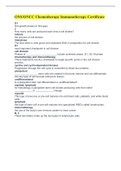
○ Probability of a (range of) outcomes is calculated using probability density
function, which calculates the area of part of the sample distribution graph
(probability = area of section)
■
■ Probability density function gives probability of values between two
thresholds (blue section)
■ Left-hand probability: values up to and including a threshold value (red
section)
■ Right-hand probability: values including and above a threshold value
(green section)
■ ^ left and right used to calculate p value
■ Total probabilities ALWAYS = 1!
● Parameter = population mean
● Random Variable: A variable that depends on chance
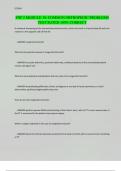
Micro lecture 1: The empirical cycle
● Observation
, ○ Sparks an idea for hypo → pattern, unexpected event, interesting relation we want
to explain
■ Source not important (personal, shared, imagined, previous research)
○ Observing relation in one or more instances [Induction]
● Induction
○ Specific to general
○ With indicative reasoning relation in specific instances is transformed into general
rule or hypo
● Deduction
○ Relation should hold in new instances
○ expectation / prediction is deduced abt new observations
○ Determine research set up
○ Define concepts, measurement instruments, procedures, sample
→ hypo is transformed with deductive reasoning & specification of research setup
● Testing
○ Inferential: decide
○ Descriptive: summarise statistical processing
■ compare data to prediction
■ Data collection
○ New data collected & w the aid of stats → compared to predictions
● Evaluation
○ Interpret results in terms of hypo
○ Prediction confirmed → Hypo provisionally supported - NOT proven
○ Preiction disconfirmed → hypo not automatically rejected - repeated with better
research set up
○ Hypo rejected (very rare)
Lecture 1:
● Empirical Cycle E.g:
, ● What is the difference between; population distribution, sample distribution, sampling
distribution?
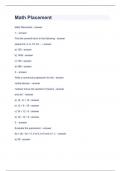
● Two hypothesis:
○
H0 HA
Skeptical POV Refute skepticism
No effect Effect
No preference ` preference
No correlation Correlation
No difference Difference
● Frequentist probability
○ Objective probability
○ Relative frequency in the long run
Tutorial 1:
● In a continuous variable, to find the probability of a single specific value = 0
● The mean of a sampling distribution is equal to the population value only if it is an
unbiased estimator
○ If we change the population proportion, the center of the sampling distribution
changes accordingly
● Larger samples create sampling distributions that are more peaked
Week 2:
Chapter 2: Probability Models
● 3 ways to construct a sampling distribution when you draw only 1 sample:
1. Bootstrapping
● Sampling with replacement from the original sample to create a sampling
distribution
2. Exact approach
● Calculate the true sampling distribution as the probabilities of
combinations of values on categorical variables
3. Theoretical approximation
● Using a theoretical probability distribution as an approximation of the
sampling distribution
● Independent samples: samples that in principle can be drawn separately
● Dependent/ paired samples: the composition of a sample depends partly or entirely on the
composition of another sample
Week 1:
Chapter 1: Sampling Distribution
● Statistical inference/inferential statistics: making inferences about the population from
the sample (generalization), through estimation and null hypothesis testing
○ Sample = random (usually)
● Sample statistic: value describing a characteristic of the sample (one outcome score)
○ E.g., how many yellow candies in a sample
○ Also called a random variable
● Sampling space: collection of all possible outcome scores/sample statistics
○ E.g. all possible quantities of yellow candies in a sample
● Sampling distribution: includes the characteristics of different possible samples that
could’ve been drawn from the population
○ All the possible sample statistic values & their probability/ probability density
○ distribution of the outcome scores of many samples
○
■ (it’s not always a normal distribution)
● Cases: the ‘things’ that are being counted→ units of analysis
● To calculate probability of a sample statistic outcome: divide number of samples with
desired outcome (e.g. all samples with 5 yellow candies) by the total number of samples
● Probability distribution: shows the probability of all outcomes in the sampling space
(changes frequency in a sampling distribution to probability)
○ Discrete: when only a limited number of outcomes are possible so you can list the
probability of each outcome separately
● Probablity density: a means of getting the probability that a continuous random variable
(like a sample statistic) falls within a particular range
● Expected value: average (mean) of the sampling distribution of a random variable
○ population proportion x total number of cases in the sample
○ The mean of a probability distribution, e.g a sampling distribution
○ If a sample statistic is an unbiased estimator of a parameter (population value), the
parameter value equals the average of the sampling distribution, which is called
the expected value or expectation
, ● Sample statistic is called an unbiased estimator of the population statistic (proportionally;
the % of yellow candies in a bag can estimate the % of yellow candies in the factory)
● Unbiased estimator: A sample statistic for which the expected value equals the
population value
● [The sampling distribution collects a large number of sample proportions. The mean of
the proportions in the sampling distribution (expected value) equals the proportion of
yellow candies in the population, because a sample proportion is an unbiased estimator of
the population proportion.]
● Population statistic AKA parameter
● We say a random sample is in principle representative or representative in the statistical
sense of the population bc it’s not always gonna be a super exact representation of the
population
● Draw 1000s of samples, calculate the mean → get true population value
● Continuous variable: We can always think of a new value in between two values
○ w/ continuous sample statistics, look at range of values
○ Probability of a (range of) outcomes is calculated using probability density
function, which calculates the area of part of the sample distribution graph
(probability = area of section)
■
■ Probability density function gives probability of values between two
thresholds (blue section)
■ Left-hand probability: values up to and including a threshold value (red
section)
■ Right-hand probability: values including and above a threshold value
(green section)
■ ^ left and right used to calculate p value
■ Total probabilities ALWAYS = 1!
● Parameter = population mean
● Random Variable: A variable that depends on chance
Micro lecture 1: The empirical cycle
● Observation
, ○ Sparks an idea for hypo → pattern, unexpected event, interesting relation we want
to explain
■ Source not important (personal, shared, imagined, previous research)
○ Observing relation in one or more instances [Induction]
● Induction
○ Specific to general
○ With indicative reasoning relation in specific instances is transformed into general
rule or hypo
● Deduction
○ Relation should hold in new instances
○ expectation / prediction is deduced abt new observations
○ Determine research set up
○ Define concepts, measurement instruments, procedures, sample
→ hypo is transformed with deductive reasoning & specification of research setup
● Testing
○ Inferential: decide
○ Descriptive: summarise statistical processing
■ compare data to prediction
■ Data collection
○ New data collected & w the aid of stats → compared to predictions
● Evaluation
○ Interpret results in terms of hypo
○ Prediction confirmed → Hypo provisionally supported - NOT proven
○ Preiction disconfirmed → hypo not automatically rejected - repeated with better
research set up
○ Hypo rejected (very rare)
Lecture 1:
● Empirical Cycle E.g:
, ● What is the difference between; population distribution, sample distribution, sampling
distribution?
● Two hypothesis:
○
H0 HA
Skeptical POV Refute skepticism
No effect Effect
No preference ` preference
No correlation Correlation
No difference Difference
● Frequentist probability
○ Objective probability
○ Relative frequency in the long run
Tutorial 1:
● In a continuous variable, to find the probability of a single specific value = 0
● The mean of a sampling distribution is equal to the population value only if it is an
unbiased estimator
○ If we change the population proportion, the center of the sampling distribution
changes accordingly
● Larger samples create sampling distributions that are more peaked
Week 2:
Chapter 2: Probability Models
● 3 ways to construct a sampling distribution when you draw only 1 sample:
1. Bootstrapping
● Sampling with replacement from the original sample to create a sampling
distribution
2. Exact approach
● Calculate the true sampling distribution as the probabilities of
combinations of values on categorical variables
3. Theoretical approximation
● Using a theoretical probability distribution as an approximation of the
sampling distribution
● Independent samples: samples that in principle can be drawn separately
● Dependent/ paired samples: the composition of a sample depends partly or entirely on the
composition of another sample