100% Zufriedenheitsgarantie Sofort verfügbar nach Zahlung Sowohl online als auch als PDF Du bist an nichts gebunden
logo-home
(MERIT CRITERIA) BTEC IT Unit 5 Data Modelling Assignment 1 - Task 3 - Analysing features of Spreadsheet (5/A.M1) 7,40 €
In den Einkaufswagen

Essay

(MERIT CRITERIA) BTEC IT Unit 5 Data Modelling Assignment 1 - Task 3 - Analysing features of Spreadsheet (5/A.M1)

1 bewertung
 1 mal verkauft
  • Kurs
  • Hochschule

This assignment received Distinction for covering 5/A.M2: Analysed how the features of spreadsheet software contribute to the decision-making process. - Unit 3 Data Modelling Assignment 1 (Task3).

vorschau 2 aus 10   Seiten

  • 5. mai 2024
  • 10
  • 2022/2023
  • Essay
  • Unbekannt
  • A+

1  bewertung

review-writer-avatar

von: tomurwin • 3 Monate vor

avatar-seller
Unit 5: Data Modelling


Analysing how the features of spreadsheet software contribute to the decision-
making process.


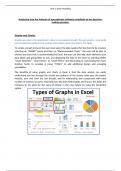
Graphs and Charts:

Graphs are where the worksheet's data is represented visually through graphs, meanwhile
charts represent patterns that contain information about the data in the table.
To create a Graph in Excel, the user must select the data needed for the chart to be created,
selecting on “INSERT” menu and then on “Recommended Charts”, the user will be able to
choose any chart that is recommended by Excel, the user can also add chart elements such
data labels and giving titles to axis, and displaying the data in the chart by selecting either
“Chart Elements”, “Chart Styles” or “Chart Filters” and decorating or customising the chart.
Another factor to consider is using “TOOLS” to add additional design and arranging
possibilities.
The benefits of using graphs and charts in Excel is that the data analyst can easily
understand and see through the trends and patterns of the cheese sales over the weeks,
months, year and even the last decade, and its relationship and comparison with total
number of cheeses, its types, exported from the both Netherlands and France, this helps the
company to set goals for the sales of cheese in the near future by using the prediction
option.

, Unit 5: Data Modelling


Data Validation:

Data validation is a feature in which it controls what the users can enter in a cell.
By making rules, when the user enters a data that violates the rule, it will display a message
informing that the user has entered an invalid data.
Creating a Validation rule is achieved by selecting the cells needed to validate, using “Data”
tab and “Data Validation” , this feature will allow the user to select any value wanted to
allow, whether a whole number, list, date and time, text length and even “any value” which
does not apply validation criteria, then the user will specify data validation rules ( note that
the validation options depend on the option selected). When a user tries to enter data that
will violate the validation rule, Excel will inform the user that the data entered in invalid by
displaying a message about the cell restricted. The user is also allowed to add input and type
in a message to inform other people when entering data in the worksheet.


By using Data Validation, the
cheese company will ensure that the data entered is accurate and valid with cleanness, so
that it can make accurate predictions of the sales of the cheese, exchange currency…etc,
from the table without errors that are subject to inaccurate data. This will ensure that the
data is not corrupted from eliminating data errors, in which it will create better results.

Alle Vorteile der Zusammenfassungen von Stuvia auf einen Blick:

Garantiert gute Qualität durch Reviews

Garantiert gute Qualität durch Reviews

Stuvia Verkäufer haben mehr als 700.000 Zusammenfassungen beurteilt. Deshalb weißt du dass du das beste Dokument kaufst.

Schnell und einfach kaufen

Schnell und einfach kaufen

Man bezahlt schnell und einfach mit iDeal, Kreditkarte oder Stuvia-Kredit für die Zusammenfassungen. Man braucht keine Mitgliedschaft.

Konzentration auf den Kern der Sache

Konzentration auf den Kern der Sache

Deine Mitstudenten schreiben die Zusammenfassungen. Deshalb enthalten die Zusammenfassungen immer aktuelle, zuverlässige und up-to-date Informationen. Damit kommst du schnell zum Kern der Sache.

Häufig gestellte Fragen

Was bekomme ich, wenn ich dieses Dokument kaufe?

Du erhältst eine PDF-Datei, die sofort nach dem Kauf verfügbar ist. Das gekaufte Dokument ist jederzeit, überall und unbegrenzt über dein Profil zugänglich.

Zufriedenheitsgarantie: Wie funktioniert das?

Unsere Zufriedenheitsgarantie sorgt dafür, dass du immer eine Lernunterlage findest, die zu dir passt. Du füllst ein Formular aus und unser Kundendienstteam kümmert sich um den Rest.

Wem kaufe ich diese Zusammenfassung ab?

Stuvia ist ein Marktplatz, du kaufst dieses Dokument also nicht von uns, sondern vom Verkäufer lydii. Stuvia erleichtert die Zahlung an den Verkäufer.

Werde ich an ein Abonnement gebunden sein?

Nein, du kaufst diese Zusammenfassung nur für 7,40 €. Du bist nach deinem Kauf an nichts gebunden.

Kann man Stuvia trauen?

4.6 Sterne auf Google & Trustpilot (+1000 reviews)

45.681 Zusammenfassungen wurden in den letzten 30 Tagen verkauft

Gegründet 2010, seit 15 Jahren die erste Adresse für Zusammenfassungen

Starte mit dem Verkauf

Kürzlich von dir angesehen


7,40 €  1x  verkauft
  • (1)
In den Einkaufswagen
Hinzugefügt