a) Variable.
A variable is a particular measurable attribute that the researcher believes is needed to describe the element of study
b) Observation.
An observation is all the information collected for each element in the study
c) Data Set.
Data set is the arrangement collection of info that contain the various categories of data that is collected for a specific study
Instructor Comments
Very good.
Answer Key
Define each of the following:
a) Variable.
a) A variable is a particular, measurable attribute that the researcher believes is needed to describe the element in their study.
b) Observation.
b) An observation is all the information collected for each element in a study.
c) Data Set.
c) A data set is an arranged collection of information that contains the various categories of data which were collected for a specific study.MATH 110 Module 1, 2, 3, 4, 5, 6, 7, 8, 9, 10 Exam (Latest-2024) Define each of the following: Exam Page 2
Explain outliers.
Outlier is a data point that differs from other observations, Comparing relationships between two sets
of data .
Instructor Comments
Very good.
Answer Key
Explain outliers.
An outlier is a value which is out of place compared to the other values (for example, it may be too large or too small compared to the other values).
Look at the following data and see if you can identify any outliers:
7 8 2 4 5 65 9 10 3 11 71 15 16 19 17
The outliers are: 65,and 71
Instructor Comments
Very good.
Answer Key
Look at the following data and see if you can identify any outliers:
7 8 2 4 5 65 9 10 3 11 71 15 16 19 17
The outliers are:
65 71
Exam Page 4
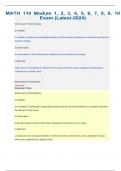
The following pie chart shows the percentages of total items sold in a month in a certain fast food restaurant. A total of 3300 fast food items were sold during the month.
How many were chicken?
How many were french fries?
How many were chicken? .20(3300)=660 fast food chickens were sold during the month.
How many were fries? .30(3300)= 990 fast food fries were sold during the month
Instructor Comments
Very good.
Answer Key
The following pie chart shows the percentages of total items sold in a month in a certain fast food restaurant. A total of 3300 fast food items were sold during the month.
How many were chicken?
How many were french fries?
Chicken : 3300(.20) = 660
French Fries: 3300(.30) = 990
Alle Vorteile der Zusammenfassungen von Stuvia auf einen Blick:
Garantiert gute Qualität durch Reviews
Stuvia Verkäufer haben mehr als 700.000 Zusammenfassungen beurteilt. Deshalb weißt du dass du das beste Dokument kaufst.
Schnell und einfach kaufen
Man bezahlt schnell und einfach mit iDeal, Kreditkarte oder Stuvia-Kredit für die Zusammenfassungen. Man braucht keine Mitgliedschaft.
Konzentration auf den Kern der Sache
Deine Mitstudenten schreiben die Zusammenfassungen. Deshalb enthalten die Zusammenfassungen immer aktuelle, zuverlässige und up-to-date Informationen. Damit kommst du schnell zum Kern der Sache.
Häufig gestellte Fragen
Was bekomme ich, wenn ich dieses Dokument kaufe?
Du erhältst eine PDF-Datei, die sofort nach dem Kauf verfügbar ist. Das gekaufte Dokument ist jederzeit, überall und unbegrenzt über dein Profil zugänglich.
Zufriedenheitsgarantie: Wie funktioniert das?
Unsere Zufriedenheitsgarantie sorgt dafür, dass du immer eine Lernunterlage findest, die zu dir passt. Du füllst ein Formular aus und unser Kundendienstteam kümmert sich um den Rest.
Wem kaufe ich diese Zusammenfassung ab?
Stuvia ist ein Marktplatz, du kaufst dieses Dokument also nicht von uns, sondern vom Verkäufer nursehailey. Stuvia erleichtert die Zahlung an den Verkäufer.
Werde ich an ein Abonnement gebunden sein?
Nein, du kaufst diese Zusammenfassung nur für 11,88 €. Du bist nach deinem Kauf an nichts gebunden.