100% Zufriedenheitsgarantie Sofort verfügbar nach Zahlung Sowohl online als auch als PDF Du bist an nichts gebunden
logo-home
Test Bank for Modern Business Statistics with Microsoft® Excel®, 8th Edition by Jeffrey D. Camm, Anderson 28,98 €
In den Einkaufswagen

Prüfung

Test Bank for Modern Business Statistics with Microsoft® Excel®, 8th Edition by Jeffrey D. Camm, Anderson

 1 mal verkauft
  • Kurs
  • Business Statistics
  • Hochschule
  • Business Statistics

Test Bank for Modern Business Statistics with Microsoft® Excel® 8e 8th Edition by Jeffrey D. Camm, James J. Cochran, Michael J. Fry, Jeffrey W. Ohlmann, David R. Anderson, Dennis J. Sweeney, Thomas A. Williams. Full Chapters test bank are included with answers (Chapter 1 to 21) 1. Data and Sta...

[ Mehr anzeigen ]
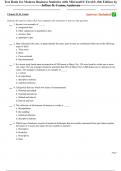
vorschau 4 aus 1152   Seiten

  • 10. juli 2024
  • 1152
  • 2023/2024
  • Prüfung
  • Fragen & Antworten
  • Business Statistics
  • Business Statistics
avatar-seller
Test Bank for Modern Business Statistics with Microsoft® Excel®, 8th Edition by
Jeffrey D. Camm, Anderson

Chapter 01 8e Camm Answers Included ✅
Indicate the answer choice that best completes the statement or answers the question.
1. Income is an example of _____.
a. categorical data
b. either categorical or quantitative data
c. currency data
d. quantitative data

2. Data collected at the same, or approximately the same, point in time are considered which one of the following
types of data?
a. Time series
b. Static
c. Cross-sectional
d. One-dimensional

3. In a recent study based upon an inspection of 200 homes in Daisy City, 120 were found to violate one or more
city codes. The city manager released a statement that 60% of Daisy City's 3,000 homes are in violation of city
codes. The manager's statement is an example of _____.
a. a census
b. an experiment
c. descriptive statistics
d. statistical inference

4. Categorical data use which two scales of measurement?
a. Nominal and ordinal
b. Nominal and interval
c. Ordinal and interval
d. Interval and ratio

5. The collection of all elements of interest in a study is _____.
a. the population
b. the sampling
c. statistical inference
d. descriptive statistics

6. Which type of analytics consists of analytical techniques that use models constructed from past data to predict
the future or to assess the impact of one variable on another?
a. Descriptive
b. Predictive
c. Prescriptive
d. Data


. Page 1

,Name: Class: Date:

Chapter 01 8e Camm

7. The graph below best exemplifies a _____.


a. bar graph
b. time series graph
c. cross-sectional graph
d. line graph

8. The graph below best exemplifies a _____.


(Graph courtesy of Robert Allison.)


a. bar graph
b. time series graph
c. cross-sectional graph
d. line graph

9. Which type of data collection method gives the researcher the most control over variables of interest?
a. Using existing data sources
b. Conducting an observational study
c. Conducting a survey
d. Conducting an experiment


. Page 2

,Name: Class: Date:

Chapter 01 8e Camm

10. When the data are labels or names used to identify an attribute of the elements and the rank of the data is
meaningful, the variable has which scale of measurement?
a. Nominal
b. Ordinal
c. Interval
d. Ratio

11. The process of analyzing sample data to draw conclusions about the characteristics of a population is called
_____.
a. descriptive statistics
b. statistical inference
c. data analysis
d. data summarization

12. A portion of the population selected to represent the population is called _____.
a. statistical inference
b. descriptive statistics
c. a census
d. a sample

13. A sample of five Fortune 500 companies showed the following revenues ($ millions): 7505.0, 2904.7, 7208.4,
6819.0, and 19500.0. Based on this information, which of the following statements is correct?
a. An estimate of the average revenue for all Fortune 500 companies is 8787.42 ($ millions).
b. The average revenue for all Fortune 500 companies is 8787.42 ($ millions).
c. Over half of all Fortune 500 companies earn at least 7208.4 ($ millions) in revenues.
d. If five other Fortune 500 companies were chosen, the average revenue would be 8787.42 ($ millions).

14. The Microsoft Office package used to perform statistical analysis is _____.
a. SPSS
b. Word
c. SAS
d. Excel

15. The birth weight of newborns, measured in grams, is an example of _____.
a. categorical data
b. either categorical or quantitative data
c. neither categorical nor quantitative data
d. quantitative data


. Page 3

, Name: Class: Date:

Chapter 01 8e Camm

16. A Scanner Data User Survey of 50 companies found that the average amount spent on scanner data per
category of consumer goods was $387,325 (Mercer Management Consulting, Inc., April 24, 1997). The $387,325
is an example of _____.
a. categorical data
b. a categorical variable
c. a descriptive statistic
d. time series data

17. The set of measurements collected for an element is called a(n) _____.
a. census
b. variable
c. observation
d. sample

18. What can be inferred about the population of all lithium batteries produced with Rogers Industries' new solid-
state technology based on the sample data showing an average battery life of 18.84 hours?
a. The population average battery life is exactly 18.84 hours.
b. The population average battery life is between 18.16 and 19.52 hours.
c. The population average battery life could be more or less than 18.84 hours.
d. The population average battery life is greater than 20 hours.

19. Which of the following terms is used to refer to the process of capturing, storing, and maintaining data?
a. Data warehousing
b. Data mining
c. Data analysis
d. Data collection

20. Which of the following is an example of quantitative data?
a. The player’s number on a baseball uniform
b. The serial number on a one-dollar bill
c. The part number of an inventory item
d. The number of people in a waiting line

21. Statistical studies in which researchers control variables of interest are referred to as which type of study?
a. Experimental
b. Control observational
c. Non-experimental
d. Observational


. Page 4

Alle Vorteile der Zusammenfassungen von Stuvia auf einen Blick:

Garantiert gute Qualität durch Reviews

Garantiert gute Qualität durch Reviews

Stuvia Verkäufer haben mehr als 700.000 Zusammenfassungen beurteilt. Deshalb weißt du dass du das beste Dokument kaufst.

Schnell und einfach kaufen

Schnell und einfach kaufen

Man bezahlt schnell und einfach mit iDeal, Kreditkarte oder Stuvia-Kredit für die Zusammenfassungen. Man braucht keine Mitgliedschaft.

Konzentration auf den Kern der Sache

Konzentration auf den Kern der Sache

Deine Mitstudenten schreiben die Zusammenfassungen. Deshalb enthalten die Zusammenfassungen immer aktuelle, zuverlässige und up-to-date Informationen. Damit kommst du schnell zum Kern der Sache.

Häufig gestellte Fragen

Was bekomme ich, wenn ich dieses Dokument kaufe?

Du erhältst eine PDF-Datei, die sofort nach dem Kauf verfügbar ist. Das gekaufte Dokument ist jederzeit, überall und unbegrenzt über dein Profil zugänglich.

Zufriedenheitsgarantie: Wie funktioniert das?

Unsere Zufriedenheitsgarantie sorgt dafür, dass du immer eine Lernunterlage findest, die zu dir passt. Du füllst ein Formular aus und unser Kundendienstteam kümmert sich um den Rest.

Wem kaufe ich diese Zusammenfassung ab?

Stuvia ist ein Marktplatz, du kaufst dieses Dokument also nicht von uns, sondern vom Verkäufer StepsSol. Stuvia erleichtert die Zahlung an den Verkäufer.

Werde ich an ein Abonnement gebunden sein?

Nein, du kaufst diese Zusammenfassung nur für 28,98 €. Du bist nach deinem Kauf an nichts gebunden.

Kann man Stuvia trauen?

4.6 Sterne auf Google & Trustpilot (+1000 reviews)

45.681 Zusammenfassungen wurden in den letzten 30 Tagen verkauft

Gegründet 2010, seit 15 Jahren die erste Adresse für Zusammenfassungen

Starte mit dem Verkauf

Kürzlich von dir angesehen


28,98 €  1x  verkauft
  • (0)
In den Einkaufswagen
Hinzugefügt