1
Chapter 3: Levels and Trends ..............................................................................................................3
1. Levels ..........................................................................................................................................3
1.1. In most European countries, inequality is more pronounced among the working aged .........3
1.2. Wealth inequality .................................................................................................................3
1.2.1. Wealth is much more unequally distributed ...................................................................3
1.2.2 Large country differences in wealth concentration .........................................................4
1.2.3. The portfolio of household wealth .................................................................................4
1.2.4. The decomposition of wealth .........................................................................................5
1.2.4. Correlation between household wealth and income ......................................................7
A) What? .............................................................................................................................7
B) In Belgium .......................................................................................................................8
............................................................................................................................................8
2. Trends .........................................................................................................................................8
2.1. Within country income inequality: Long term trends in the OECD area .................................8
A) Income inequality increased in most, but not all OECD countries .....................................8
B) Changes in income inequality were not only about the top ..............................................9
C) Episodes of inequality changes ...................................................................................... 10
D) Shares of very high incomes increased, in some countries by a lot ................................ 10
E) In some countries, 20% and more of long-term income growth has been captured by the
top 1% ............................................................................................................................... 11
F) Even in countries where growth of top 1% was moderate, the very top shares have
increased a lot ................................................................................................................... 11
2.2. Within country wealth inequality........................................................................................ 12
2.2.1. Top 10% net personal wealth share ............................................................................. 12
2.2.2. Within country wealth inequality is driven by the top 1% ............................................. 12
2.2.3. Wealth concentration in France ................................................................................... 13
2.2.4. The very long term trend of increasing wealth concentration at the top continued
during the past decade, with a few notable exceptions ......................................................... 13
2.3. Global income inequality .................................................................................................... 13
2.3.1. Introduction: Three concepts of inequality................................................................... 13
2.3.2. Milanovic: Global inequality – Population-weighted inter-country inequality –
Unweighted inter-country inequality ..................................................................................... 14
2.3.3. Global vs US-inequality ................................................................................................ 15
2.3.4. Location vs Class component ....................................................................................... 15
A) What? ........................................................................................................................... 15
B) Graphical ....................................................................................................................... 15
2.3.5. Citizenship premium vs Citizenship penalty.................................................................. 16
, 2
A) What? ........................................................................................................................... 16
B) Graphical ....................................................................................................................... 16
2.3.6. The elephant curve ...................................................................................................... 18
A) What? ........................................................................................................................... 18
B) Graphical ....................................................................................................................... 19
2.3.7. The global 1% .............................................................................................................. 20
2.3.8. The elephant who lost its trunk .................................................................................... 20
, 3
Chapter 3: Levels and Trends
1. Levels
1.1. In most European countries, inequality is more pronounced among the working aged
The gini coefficient lies higher for the working aged. This is because:
• More wage disparities on the labour market
• Part-time and temporary work pays less and offers fewer benefits than fulltime work
• People in the working-age group experience different rates of career progression, with some
moving up quickly and others remaining in lower positions
• Many European countries have relatively generous pension systems thus providing a more
equal income distribution among the elderly
• The elderly benefit more from social transfers such as healthcare subsidies
• Elderly individuals often have more accumulated assets
In a few countries the gini coefficient is higher for the elderly population (Mexico, Chile, Korea,
Lithuania, the US, Australia, New Zealand). This is because:
• The pension systems in some countries is not designed to equalize incomes among the
pensioned
• Countries like Chile have highly privatized pension systems
• In some countries labour market participation is still high among the elderly
1.2. Wealth inequality
1.2.1. Wealth is much more unequally distributed
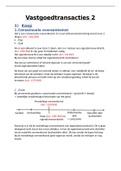
This table compares the share of income and
wealth going to different parts of the income and
wealth distribution in 2019 for the OECD and the
USA:
• The top 10% in the USA hold a much higher
proportion of wealth (79%) compared to the
OECD average (52%).
• Wealth distribution is more unequal than income distribution, especially in the USA.
Chapter 3: Levels and Trends ..............................................................................................................3
1. Levels ..........................................................................................................................................3
1.1. In most European countries, inequality is more pronounced among the working aged .........3
1.2. Wealth inequality .................................................................................................................3
1.2.1. Wealth is much more unequally distributed ...................................................................3
1.2.2 Large country differences in wealth concentration .........................................................4
1.2.3. The portfolio of household wealth .................................................................................4
1.2.4. The decomposition of wealth .........................................................................................5
1.2.4. Correlation between household wealth and income ......................................................7
A) What? .............................................................................................................................7
B) In Belgium .......................................................................................................................8
............................................................................................................................................8
2. Trends .........................................................................................................................................8
2.1. Within country income inequality: Long term trends in the OECD area .................................8
A) Income inequality increased in most, but not all OECD countries .....................................8
B) Changes in income inequality were not only about the top ..............................................9
C) Episodes of inequality changes ...................................................................................... 10
D) Shares of very high incomes increased, in some countries by a lot ................................ 10
E) In some countries, 20% and more of long-term income growth has been captured by the
top 1% ............................................................................................................................... 11
F) Even in countries where growth of top 1% was moderate, the very top shares have
increased a lot ................................................................................................................... 11
2.2. Within country wealth inequality........................................................................................ 12
2.2.1. Top 10% net personal wealth share ............................................................................. 12
2.2.2. Within country wealth inequality is driven by the top 1% ............................................. 12
2.2.3. Wealth concentration in France ................................................................................... 13
2.2.4. The very long term trend of increasing wealth concentration at the top continued
during the past decade, with a few notable exceptions ......................................................... 13
2.3. Global income inequality .................................................................................................... 13
2.3.1. Introduction: Three concepts of inequality................................................................... 13
2.3.2. Milanovic: Global inequality – Population-weighted inter-country inequality –
Unweighted inter-country inequality ..................................................................................... 14
2.3.3. Global vs US-inequality ................................................................................................ 15
2.3.4. Location vs Class component ....................................................................................... 15
A) What? ........................................................................................................................... 15
B) Graphical ....................................................................................................................... 15
2.3.5. Citizenship premium vs Citizenship penalty.................................................................. 16
, 2
A) What? ........................................................................................................................... 16
B) Graphical ....................................................................................................................... 16
2.3.6. The elephant curve ...................................................................................................... 18
A) What? ........................................................................................................................... 18
B) Graphical ....................................................................................................................... 19
2.3.7. The global 1% .............................................................................................................. 20
2.3.8. The elephant who lost its trunk .................................................................................... 20
, 3
Chapter 3: Levels and Trends
1. Levels
1.1. In most European countries, inequality is more pronounced among the working aged
The gini coefficient lies higher for the working aged. This is because:
• More wage disparities on the labour market
• Part-time and temporary work pays less and offers fewer benefits than fulltime work
• People in the working-age group experience different rates of career progression, with some
moving up quickly and others remaining in lower positions
• Many European countries have relatively generous pension systems thus providing a more
equal income distribution among the elderly
• The elderly benefit more from social transfers such as healthcare subsidies
• Elderly individuals often have more accumulated assets
In a few countries the gini coefficient is higher for the elderly population (Mexico, Chile, Korea,
Lithuania, the US, Australia, New Zealand). This is because:
• The pension systems in some countries is not designed to equalize incomes among the
pensioned
• Countries like Chile have highly privatized pension systems
• In some countries labour market participation is still high among the elderly
1.2. Wealth inequality
1.2.1. Wealth is much more unequally distributed
This table compares the share of income and
wealth going to different parts of the income and
wealth distribution in 2019 for the OECD and the
USA:
• The top 10% in the USA hold a much higher
proportion of wealth (79%) compared to the
OECD average (52%).
• Wealth distribution is more unequal than income distribution, especially in the USA.