100% Zufriedenheitsgarantie Sofort verfügbar nach Zahlung Sowohl online als auch als PDF Du bist an nichts gebunden
logo-home
Summary MVDA SPSS Exam Guide 3,88 €
In den Einkaufswagen

Zusammenfassung

Summary MVDA SPSS Exam Guide

 12 mal angesehen  0 mal verkauft
  • Kurs
  • Hochschule

Dit document bevat de meeste (bijna alle) belangrijke opdrachten van de werkgroepen verwerkt in een exam guide. De soort vraag staat dik gedrukt, met daaronder de stappen hoe je het in SPSS moet verwerken (om evt mee naar je tentamen te nemen maar als je de vraagstelling niet meer snap/niet meer we...

[ Mehr anzeigen ]
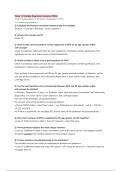
vorschau 3 aus 25   Seiten

  • 24. oktober 2024
  • 25
  • 2023/2024
  • Zusammenfassung
avatar-seller
Week 1 | Multiple Regression Analysis (MRA)
When? Independent X1, X2 (INT) + Dependent Y (INT)
Y is always regressed on X
Q: Calculate the Pearson correlations between the five variables.
Analyze > Correlate > Bivariate > insert variables >


Q: What is the sample size N?
Under ‘N’


Q: Does it make sense to perform a linear regression of GPA on IQ, age, gender and/or
self-concept?
Check ‘Correlations’ table and check for each variable the correlation and the significance, if it’s
significant we can say it makes sense or think theoretically


Q: Which variable is likely to be a good predictor of GPA?
Check ‘Correlations’ table and check for each variable the correlation and the significance, if it’s
significant it is likely to be a good predictor


Next, perform a linear regression of GPA on IQ, age, gender and self-concept. In Statistics, ask for
part and partial correlations, and collinearity diagnostics. In Save ask for Cook’s distances and
Leverage values.


Q: Can the null hypothesis of no relationship between GPA and IQ, age, gender and/or
self-concept be rejected?
< Analyze > Regression > Linear > in ‘Statistics’ check ‘part and partial correlations’ and ‘collinearity
diagnostics’ > in ‘Save’ ask for ‘Cook’s distances’ and ‘Leverage values’
H0: none of the predictors are good predictors
Ha: at least some of the predictors are good predictors
• Check ANOVA table > report the F value → e.g. F(dfregression, dfresidual) = value → F(4,73) =
23.117, p<0.001
• If F value is significant, we can reject H0, at least some of the predictors are good predictors


Q: How much variance of GPA is explained by IQ, age, gender and SC together?
• Look at ‘Model Summary’ table > look at R squared > report the value


Q: What predictor explains the most unique variance?
• Look at ‘Coefficients’ table > under ‘correlations’ look at the ‘part’ column > the biggest number
should be squared, that variable explains the most unique variance


Q: Is there evidence of multicollinearity in the predictors?
Test whether we have too much of a dependence between our predictors
• Look at ‘Coefficients’ table and under VIF column > VIF should be below 10 > Tolerance needs to
be bigger than 0.1

,Q: Do Cook’s distances and Leverage values suggest the presence of outliers?
• Formula center leverage value: 3(p+1)/N where p = number of predictors > the value calculated is
the largest value we can have in the centered leverage values > look at ‘Residuals Statistics’ under
‘maximum’ column at ‘centered leverage value’ > determine whether the calculate value is higher
than the maximum value in the table > if value calculated is bigger than given value, it suggests
outliers
• Cook’s distance tells us whether an outlier is influential > look at ‘Residuals Statistics’ > check
Cook’s distance value under ‘minimum’ and ‘maximum’ > should not be higher than 1


Q: If one or more outliers are detected, all previous steps are repeated with exclusion of the
outlier(s). Use Selection to get rid of the outlier(s).
• Look at Data View tab > go to new Cook’s Distance variable > select with right mouse and click
‘sort descending’ > look at which participants have a distance above 1 > don’t delete the participant
> go to ‘Data’ and ‘Select cases’ > click ‘if conditions is satisfied’ and insert criteria of the study (e.g.
participants should be below the age of 14)


Q: Finally, remove the non-significant predictors from the model
• Run the analysis of LRA again > remove Cook’s Distance and Leverage under ‘Save’ > Look at
‘Coefficients’ table and look at whether the variables are significant (<0.05) and determine the ones
that are not significant


Q: Perform a linear regression of GPA on the remaining predictors. In Plots, make a scatter plot
of the standardized predicted values versus the standardized residuals, and ask for the normal
probability plot.
• Run LRA again > remove non-significant predictors > in ‘Plots’ add ZPred to X and ZResid to Y and
check normality probability plot


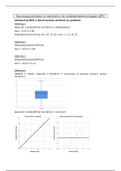
Q: Is there evidence of non-linearity, heteroscedasticity or non-normality of the residuals?
• Look at ‘Scatterplot’
• Linearity = if one creases the other increases, if one decreases the other one decreases > the plot
should look like there is no relationship (look a bunch of random spots) and if the best description is
a horizontal line there is evidence of non-linearity
• Heteroscedasticity → we want homoscedasticity > so we don’t want differences > check from
value 0 on the Y-axis, if there is approx the same amount of dots on both sides, we don’t violate the
assumption of heteroscedasticity
• Normality → look at ‘Normal P-P Plot of Regression’ > the more the dots are on the line the better
the normality → ??????


Q: What is the estimated regression equation? Interpret the regression coefficients.
• Look at ‘Coefficients’ table > constant = intercept (b0) > b1 = variables > add constant and all
variables in the equation
• ŷ = b0 + b1(var) → use unstandardized


Q: How much variance of GPA is explained by the predictors?

, • Look at ‘Model Summary’ and R squared


Q: What predictor explains the most unique variance?
• Look at ‘Coefficients’ table > look under ‘correlations’ and ‘part’ > report the biggest number and
square it


Hierarchical Regression Analysis
Q: How much variance of VarX is explained by VarY?
• Check ‘Model Summary’ table > check R squared


Q: add VarZ as a predictor in a second block to the linear model. In Statistics, ask for R squared
change
Analyze > Regression > Linear > add predictor to Independent in Next’ Block > in ‘Statistics’ ask for
‘R squared change’ > check the same options under ‘Statistics’


Q: Does adding VarZ significantly improve the linear model?
• Look at the ‘Model Summary’ table > look at R squared change > if the model contributed, the
value under model 2 should be positive (and thus the R square has become higher with model 2 >
report the significaince with F and df


Q: Is there evidence of non-linearity, heteroscedasticity or non-normality of the residuals?


In this example we don’t violate the assumption of linearity, heteroscedasticity, or normality


Q: What is the estimated regression equation? Interpret the regression coefficients.
• Do the same as a normal regression equation, except we now look at the values for model 2
• If everything else remains the same, improving 1 point of the score of VarY (independent), would
make the predicted score of VarX (dependent) … (value of VarY B unstandardized) higher
• If we hold everything else the same, if a participant scores one point higher on VarZ, the predicted
value of VarX (dependent) would become (value of VarZ B unstandardized) higher


Q: How much variance of VarX is explained by VarY and VarZ together?
• Look at ‘Model Summary’ > look at R square model 2 > that would explain the variance


Q: How much variance is uniquely explained by neuroticism?

Alle Vorteile der Zusammenfassungen von Stuvia auf einen Blick:

Garantiert gute Qualität durch Reviews

Garantiert gute Qualität durch Reviews

Stuvia Verkäufer haben mehr als 700.000 Zusammenfassungen beurteilt. Deshalb weißt du dass du das beste Dokument kaufst.

Schnell und einfach kaufen

Schnell und einfach kaufen

Man bezahlt schnell und einfach mit iDeal, Kreditkarte oder Stuvia-Kredit für die Zusammenfassungen. Man braucht keine Mitgliedschaft.

Konzentration auf den Kern der Sache

Konzentration auf den Kern der Sache

Deine Mitstudenten schreiben die Zusammenfassungen. Deshalb enthalten die Zusammenfassungen immer aktuelle, zuverlässige und up-to-date Informationen. Damit kommst du schnell zum Kern der Sache.

Häufig gestellte Fragen

Was bekomme ich, wenn ich dieses Dokument kaufe?

Du erhältst eine PDF-Datei, die sofort nach dem Kauf verfügbar ist. Das gekaufte Dokument ist jederzeit, überall und unbegrenzt über dein Profil zugänglich.

Zufriedenheitsgarantie: Wie funktioniert das?

Unsere Zufriedenheitsgarantie sorgt dafür, dass du immer eine Lernunterlage findest, die zu dir passt. Du füllst ein Formular aus und unser Kundendienstteam kümmert sich um den Rest.

Wem kaufe ich diese Zusammenfassung ab?

Stuvia ist ein Marktplatz, du kaufst dieses Dokument also nicht von uns, sondern vom Verkäufer larathape. Stuvia erleichtert die Zahlung an den Verkäufer.

Werde ich an ein Abonnement gebunden sein?

Nein, du kaufst diese Zusammenfassung nur für 3,88 €. Du bist nach deinem Kauf an nichts gebunden.

Kann man Stuvia trauen?

4.6 Sterne auf Google & Trustpilot (+1000 reviews)

45.681 Zusammenfassungen wurden in den letzten 30 Tagen verkauft

Gegründet 2010, seit 15 Jahren die erste Adresse für Zusammenfassungen

Starte mit dem Verkauf
3,88 €
  • (0)
In den Einkaufswagen
Hinzugefügt