100% satisfaction guarantee Immediately available after payment Both online and in PDF No strings attached
logo-home
Statistiek 2 samenvatting (statistiek in 20 stappen hoofdstuk 13 t/m 19) $6.89
Add to cart

Summary

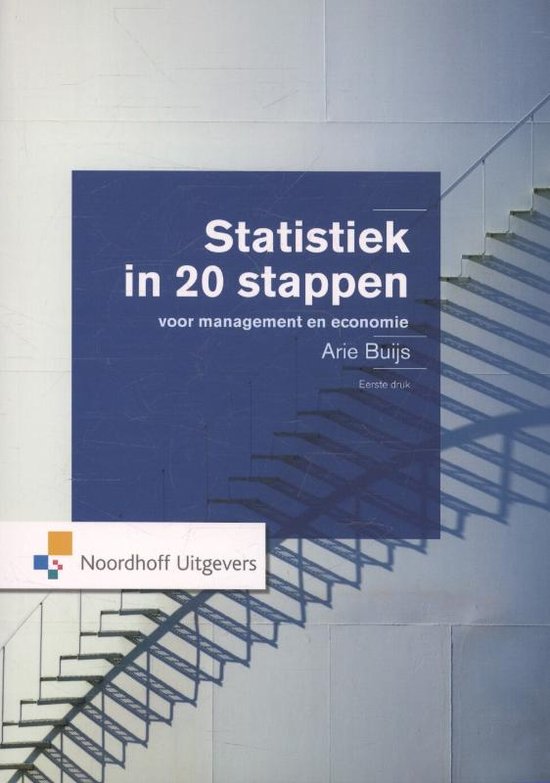
Statistiek 2 samenvatting (statistiek in 20 stappen hoofdstuk 13 t/m 19)

 26 views  2 purchases
  • Course
  • Institution
  • Book

In deze samenvatting vind je alles om het vak statistiek 2 te behalen. Inclusief voorbeelden en duidelijke beschrijvingen van de theorie. Hoofdstuk 13 t/m 19 staan in deze samenvatting uitgewerkt.

Preview 3 out of 26  pages

  • No
  • Hoofdstuk 13 t/m 19
  • April 7, 2021
  • 26
  • 2020/2021
  • Summary
avatar-seller
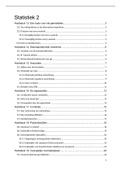
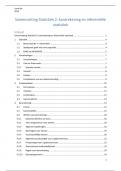
Statistiek 2
Hoofdstuk 13: Een toets voor het gemiddelde..............................................................3
13.1 De nulhypothese en de alternatieve hypothese.........................................................................3
13.3 Toetsen met een p-waarde.........................................................................................................5
13.3.1 Eenzijdig toetsen met een p-waarde...................................................................................5
13.3.2 Tweezijdig toetsen met p-waarde.......................................................................................5
Formules en betekenissen..................................................................................................................5
Hoofdstuk 14: Standaarddeviatie onbekend.................................................................6
14.1 Schatten van de standaarddeviatie.............................................................................................6
14.2 𝒕−waarde aflezen.......................................................................................................................6
14.3 Betrouwbaarheidsinterval voor 𝝁..............................................................................................6
Hoofdstuk 15: Associatie...............................................................................................7
15.1 Kijken naar de kruistabel............................................................................................................7
15.2 Maatstaf van Yule.......................................................................................................................8
15.2.2 Maximale positieve samenhang..........................................................................................9
15.2.3 Maximale negatieve samenhang.........................................................................................9
15.2.4 Geen verband....................................................................................................................10
15.3 Relatief risico (RR).....................................................................................................................11
Hoofdstuk 16: De regressielijn....................................................................................12
16.1 Verbanden tussen variabelen...................................................................................................12
16.2 Wat is de beste lijn?..................................................................................................................13
16.3 Voorspellen met de regressielijn..............................................................................................14
Hoofdstuk 17: Correlatie..............................................................................................15
17.1 Een verkenning van samenhang...............................................................................................15
17.2 De correlatiecoëfficiënt............................................................................................................16
17.3 Aandachtspunten.....................................................................................................................17
Hoofdstuk 18: Prijsindexcijfers....................................................................................18
18.1 Absoluut en relatief..................................................................................................................18
18.2 Indexcijfers (Enkelvoudig).........................................................................................................19
18.3 Samengestelde indexcijfers......................................................................................................20
18.3.1 Ongewogen samengestelde indexcijfers...........................................................................20
18.3.2 Indexcijfer van Laspeyres (Duits econoom).......................................................................22
18.3.3 Indexcijfer van Paasche (Duits statisticus en econoom)....................................................22
Hoofdstuk 19: Voorspellen met tijdreeksen.................................................................23
19.1 Voortschrijdende gemiddelden................................................................................................23

1

, 19.2 Trendlijnen................................................................................................................................25


Hoorcollege 1 (7 september) Hoofdstuk 13 + 14
Hoorcollege 2 (14 september) Hoofdstuk 15
Hoorcollege 3 (22 september) Hoofdstuk 17
Hoorcollege 4 (29 september) Hoofdstuk 16
Hoorcollege 5 (6 oktober) Hoofdstuk 18
Hoorcollege 6 (19 oktober) Hoofdstuk 19


2

, Hoofdstuk 13: Een toets voor het gemiddelde
13.1 De nulhypothese en de alternatieve hypothese
• H0: Nulhypothese: uitspraak waarvan je de geldigheid wilt controleren
• H1: Alternatieve hypothese: uitspraak die geldig is als de nulhypothese verworpen wordt
Als een autoproducent zegt dat een nieuw model een gemiddeld benzineverbruik heeft van
9,3 liter per 100 km., dan willen we dat feit controleren.
• Tweezijdig toetsen: 𝐻0: 𝜇 = 9,3 en 𝐻1: 𝜇 ≠ 9,3
Als een autoproducent zegt dat een nieuw model hoogstens 9,3 liter per 100 km. verbruikt,
dan willen we die garantie controleren.
• Eenzijdig toetsen: 𝐻0: 𝜇 ≤ 9,3 en 𝐻1: 𝜇 > 9,3


3

The benefits of buying summaries with Stuvia:

Guaranteed quality through customer reviews

Guaranteed quality through customer reviews

Stuvia customers have reviewed more than 700,000 summaries. This how you know that you are buying the best documents.

Quick and easy check-out

Quick and easy check-out

You can quickly pay through credit card or Stuvia-credit for the summaries. There is no membership needed.

Focus on what matters

Focus on what matters

Your fellow students write the study notes themselves, which is why the documents are always reliable and up-to-date. This ensures you quickly get to the core!

Frequently asked questions

What do I get when I buy this document?

You get a PDF, available immediately after your purchase. The purchased document is accessible anytime, anywhere and indefinitely through your profile.

Satisfaction guarantee: how does it work?

Our satisfaction guarantee ensures that you always find a study document that suits you well. You fill out a form, and our customer service team takes care of the rest.

Who am I buying these notes from?

Stuvia is a marketplace, so you are not buying this document from us, but from seller daniquetiemens. Stuvia facilitates payment to the seller.

Will I be stuck with a subscription?

No, you only buy these notes for $6.89. You're not tied to anything after your purchase.

Can Stuvia be trusted?

4.6 stars on Google & Trustpilot (+1000 reviews)

48072 documents were sold in the last 30 days

Founded in 2010, the go-to place to buy study notes for 15 years now

Start selling
$6.89  2x  sold
  • (0)
Add to cart
Added