100% satisfaction guarantee Immediately available after payment Both online and in PDF No strings attached
logo-home
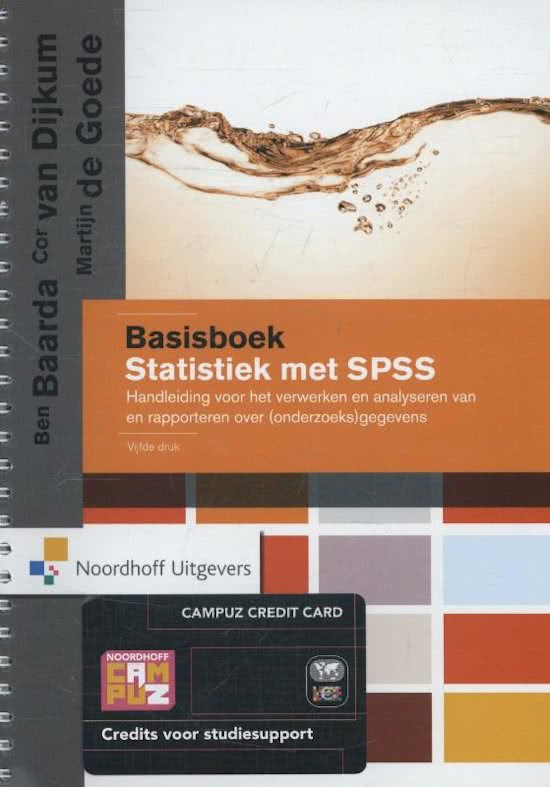
Samenvatting college aantekeningen Onderzoek II/SPSS (TPH02-18) Basisboek statistiek met SPSS, ISBN: 9789001834371 $4.90
Add to cart

Class notes

Samenvatting college aantekeningen Onderzoek II/SPSS (TPH02-18) Basisboek statistiek met SPSS, ISBN: 9789001834371

 41 views  7 purchases
  • Course
  • Institution
  • Book

In dit document is een samenvatting gemaakt van de college aantekeningen van Onderzoek II/SPSS (jaar 2) van Toegepaste Psychologie aan de Hogeschool Leiden. Voor de toets kun je goed voorbereiden met deze aantekeningen. Daarnaast staan er extra tips in die tijdens colleges benoemd zijn! Succes met ...

[Show more]
Preview 3 out of 19  pages

  • April 19, 2021
  • 19
  • 2020/2021
  • Class notes
  • -
  • All classes
avatar-seller
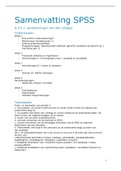
Samenvatting SPSS
A.d.h.v. aantekeningen van alle colleges
Onderwerpen
Week 1
- Drie soorten onderzoeksvragen
- Meetniveaus (herhaling jaar 1)
- Schema analysetechnieken
- Frequentievragen: Beschrijvende statistiek (gem/SD standaard deviatie/% etc.)
(herhaling jaar 1)

Week 2
- Toetsende statistiek en hypothesen
- Verschilvragen I: Chi-kwadraart (met 1 variabele en kruistabel)

Week 3
- Verschilvragen II: t-toets (in groepen)

Week 4
- Verschil III: ANOVA (eenweg)

Week 5
Samenhangvragen:
- Spearman, Pearson correlatie

Week 6
- Techniekkeuze
- Interpretatie
- Herhalen frequentievragen


Toetsdoelen
Toets- en leerdoelen van periode 3
1. Accuratesse: de student werkt precies en werkt zonder fouten de stappen per
onderzoeksvraag uit.
2. De student formuleert een volledig en correct antwoord op onderzoeksvragen. Dit
doet hij door de volgende stappen uit te voeren:
a. keuze voor de juiste analysetechniek;
b. correcte uitvoering van de techniek in SPSS;
c. correct overnemen van de benodigde informatie vanuit SPSS en daarmee
beschrijven van het resultaat;
d. interpretatie (met daarin het antwoord op de onderzoeksvraag) op basis van
het resultaat.
Ad 2: de analysetechnieken die in de cursus en dus ook in de toets aan bod (kunnen)
komen, zijn:
• Beschrijvende technieken (modus, mediaan, gemiddelde, standaarddeviatie,
staafdiagram, cirkeldiagram, histogram, scatterplot, boxplot)
• Toetsende technieken voor verschillen tussen groepen: Chi-kwadraat, t-toets,
eenweg ANOVA
• Toetsende statistieken voor samenhang tussen variabelen: correlaties (Pearson en
Spearman)


1

,Inhoud
A.d.h.v. aantekeningen van alle colleges.................................................................................................. 1
Onderwerpen........................................................................................................................................... 1
Toetsdoelen............................................................................................................................................. 1
Week 1......................................................................................................................................................... 4
Soorten onderzoeksvragen: frequentievragen, verschilvragen, samenhangvragen.................................4
Meetniveaus............................................................................................................................................ 4
Schema analysetechnieken...................................................................................................................... 5
Grafisch weergeven (zie ook H4 boek) voorbeelden................................................................................5
Week 2......................................................................................................................................................... 5
Stappenplan toetsende statistiek............................................................................................................. 5
Alfa en significantie (betrouwbaarheid)................................................................................................... 6
Analyse verschilvragen............................................................................................................................. 6
Chi-kwadraat............................................................................................................................................ 6
Stappen SPSS Chi-kwadraat...................................................................................................................... 6
Rapporteren de resultaten chi-kwadraat................................................................................................. 7
Week 3......................................................................................................................................................... 7
Verschilvraag toetsvariabele = interval/ ratio (scale)...............................................................................8
T-toets...................................................................................................................................................... 8
Stappenplan T-toets................................................................................................................................. 9
T-toets stappenplan SPSS......................................................................................................................... 9
Levene’s toets (vanaf stappenplan 1c t/m 4)........................................................................................... 9
Effectgrootte t-toets: Hedges’ g............................................................................................................. 11
Week 4....................................................................................................................................................... 12
Variantieanalyse: ANOVA....................................................................................................................... 12
Stappen ANOVA..................................................................................................................................... 13
F-toets uitvoeren SPSS (stap 2).............................................................................................................. 13
Post hoc-toetsen (Tukey’s HSD) (stap 3)................................................................................................. 14
Week 5....................................................................................................................................................... 15
Samenhang tussen twee variabele......................................................................................................... 15
Pearson correlatie (r xy)......................................................................................................................... 15
Stappen pearsons correlatie spss........................................................................................................... 15
Samenhang ordinaal: spearman’s correlatie.......................................................................................... 16
Stappen Spearman’s correlatie SPSS...................................................................................................... 16
Scatterplot............................................................................................................................................. 17
Week 6/Responsiecollege.......................................................................................................................... 17


2

, Aantekeningen responsiecollege............................................................................................................ 17
Korte samenvatting t-toets.................................................................................................................... 18
Korte samenvatting ANOVA................................................................................................................... 18
Korte samenvatting Chi-kwadraat.......................................................................................................... 18
Korte samenvating Pearson correlatie................................................................................................... 18
Korte samenvatting Spearmanrangorde-correlatie................................................................................19


3

The benefits of buying summaries with Stuvia:

Guaranteed quality through customer reviews

Guaranteed quality through customer reviews

Stuvia customers have reviewed more than 700,000 summaries. This how you know that you are buying the best documents.

Quick and easy check-out

Quick and easy check-out

You can quickly pay through credit card or Stuvia-credit for the summaries. There is no membership needed.

Focus on what matters

Focus on what matters

Your fellow students write the study notes themselves, which is why the documents are always reliable and up-to-date. This ensures you quickly get to the core!

Frequently asked questions

What do I get when I buy this document?

You get a PDF, available immediately after your purchase. The purchased document is accessible anytime, anywhere and indefinitely through your profile.

Satisfaction guarantee: how does it work?

Our satisfaction guarantee ensures that you always find a study document that suits you well. You fill out a form, and our customer service team takes care of the rest.

Who am I buying these notes from?

Stuvia is a marketplace, so you are not buying this document from us, but from seller rannathais. Stuvia facilitates payment to the seller.

Will I be stuck with a subscription?

No, you only buy these notes for $4.90. You're not tied to anything after your purchase.

Can Stuvia be trusted?

4.6 stars on Google & Trustpilot (+1000 reviews)

52510 documents were sold in the last 30 days

Founded in 2010, the go-to place to buy study notes for 14 years now

Start selling
$4.90  7x  sold
  • (0)
Add to cart
Added