100% satisfaction guarantee Immediately available after payment Both online and in PDF No strings attached
logo-home
Statistics week 6 tm 10 $8.49
Add to cart

Class notes

Statistics week 6 tm 10

 9 views  0 purchase
  • Course
  • Institution

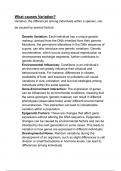
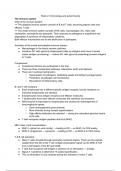
In this document you will find a summary of all treated substance from week 6 to 10 for the course MCRS, part statistics.

Preview 2 out of 9  pages

  • April 21, 2021
  • 9
  • 2020/2021
  • Class notes
  • Jack cairns
  • All classes
avatar-seller
STATISTICS week 6
Comparing the mean of two groups
Paired samples t-test
Compares two means based on paired (related) data. Data from the same people
measured at different times. You compare means within a group.
Independent sample t-test
Compares two means based on independent data. Data from different groups of
people. You compare between groups. The observations are dependent.

T-test assumptions
- Test on means: interval/ratio
- The dependent variable needs to be interval/ratio, the independent variable is
categorical with two groups
- Compares groups: 2 groups
- You need a random sample
- You need a normal distribution
- Normal distribution/N>30 (paired)
- Observations are dependent (paired)
- Likert scale is interval
D = mean/standard deviation
Always check the effect size that tells you if the difference is practically relevant. The
formula for the paired sample t-test is d = difference mean/standard deviation.
0,2 = small
0,5 = medium
0,8 = large

Paired samples t-test in SPSS
Analyze > compare means > paired samples t-test > select two variables (first: post
variable, second: pre variable) > options: 95% confidence > paste > run

Report paired samples t-test
A dependent t-test revealed that hygiene scores on day 1 (M=1.65, SD=0.64) were
significantly higher than hygiene scores on day 3 (M=0.98, SD=0.71) when visiting a
festival, t(122)=10.59, p<.001, d=0.95, 95% CI [0.55, 0.80]. We reject the null hypothesis
that in the population there is no difference in hygiene scores between day 1 and day 3.

What can we see in the test results?
Mean difference, standard deviation, standard error and a confidence interval, t, d, p.

Confidence interval 95%
No zero in the confidence interval, hence the mean difference is likely to not be zero in the
population (95% confident). If there is a zero in the confidence interval, the mean
difference is likely to be zero in the population. So we are 95% confident that there is no
mean difference. This is the case when the result is not significant.

Comparing 2 groups (independent sample t-test)
We look at the difference in means between the groups.
H0: In the population the mean score for (women) is not different from the mean
score for (men)

1

, H1: In the population the mean score for (women) is different from the mean score
for (men)
The variance in both groups are equal!

Levene’s test
After running the test first check the Levene’s test. It gives you a F-value and a significant
value.
H0: In the population there is no difference in variances
H1: In the population there is a difference in variances.
If the Levene’s test is significant, you reject the null hypothesis, there is a difference in
variances. If the Levene’s test isn’t significant, you retain the null hypothesis, there is no
difference in variances. You don’t want to reject your null hypothesis because the variance
in both groups have to be equal so you don’t want a significant p-value. If you have a
significant F-value you need to check the ‘equal variances not assumed’ row.

If you want to know if the independent sample t-test is significant you check the ‘sig. (2-
tailed)’ column and choose the correct row.

Use this formula to calculate Cohen’s d for independent t-test: d = (2*t)/√df

Independent sample t-test in SPSS
Analyze > compare means > independent samples t-test > select numeric variable >
identify the groups you want to compare > options: 95% confidence > paste > run

Report independent sample t-test
An independent samples t-test was conducted to examine whether women and men
differed in how worries they are after being exposed to threatening search results about a
health symptom. Levene’s test for equality of variances was not significant, F=0.95, p
= .333. Results revealed that women were not significantly more worried (M=3.13,
SD=1.62) than men (M=2.50, SD=1.31), t(114)=-1.92, p = .057, 95% CI [-1.28, 0.02],
d=0.36. We found no support for the alternative hypothesis.

STATISTICS week 7
Comparing more than 2 groups > ANOVA
1. When the independent variable is categorical
2. When we want to compare more than 2 groups
3. When the dependent variable is numerical (at least interval)
4. Participants are randomly assigned (everyone has an equal probability of being
assigned to a certain group)
5. Groups are of approximate equal size (10%) or equal variances for the dependent
variable in the population (F-test).

H0: In the population the mean does not differ between groups
H1: In the population at least two of the group means differ

Equal variance in the population
Check homogeneity of variance when largest group is more than 10% larger than the
smallest group. If the Levence’s test is significant then that means the variances between
the groups are not equal. You mention in the end that you did not meet the assumption of
equality of variances.

Tables from one way ANOVA

2

The benefits of buying summaries with Stuvia:

Guaranteed quality through customer reviews

Guaranteed quality through customer reviews

Stuvia customers have reviewed more than 700,000 summaries. This how you know that you are buying the best documents.

Quick and easy check-out

Quick and easy check-out

You can quickly pay through credit card or Stuvia-credit for the summaries. There is no membership needed.

Focus on what matters

Focus on what matters

Your fellow students write the study notes themselves, which is why the documents are always reliable and up-to-date. This ensures you quickly get to the core!

Frequently asked questions

What do I get when I buy this document?

You get a PDF, available immediately after your purchase. The purchased document is accessible anytime, anywhere and indefinitely through your profile.

Satisfaction guarantee: how does it work?

Our satisfaction guarantee ensures that you always find a study document that suits you well. You fill out a form, and our customer service team takes care of the rest.

Who am I buying these notes from?

Stuvia is a marketplace, so you are not buying this document from us, but from seller machteldbooms. Stuvia facilitates payment to the seller.

Will I be stuck with a subscription?

No, you only buy these notes for $8.49. You're not tied to anything after your purchase.

Can Stuvia be trusted?

4.6 stars on Google & Trustpilot (+1000 reviews)

59063 documents were sold in the last 30 days

Founded in 2010, the go-to place to buy study notes for 15 years now

Start selling
$8.49
  • (0)
Add to cart
Added