100% satisfaction guarantee Immediately available after payment Both online and in PDF No strings attached
logo-home
Summary Psychometrics Lecture Notes $6.47   Add to cart

Summary

Summary Psychometrics Lecture Notes

 30 views  2 purchases
  • Course
  • Institution

This document contains lecture notes from ALL psychometrics lectures, as well as comments and remarks made from the lectures. It has everything you need that will help you pass the final exam!

Preview 4 out of 82  pages

  • April 28, 2021
  • 82
  • 2020/2021
  • Summary
avatar-seller
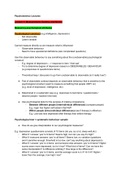
Psychometrics Lectures

Lecture 1: Measurement, Scaling, and Norms

Measuring psychological attributes

Psychological construct (e.g.intelligence, depression)
- Not observable
- Latent variable

Cannot measure directly so we measure what is influenced
- Observable behaviour
- Need to have operational definitions (ask complicated questions)

Use this observable behaviour to say something about the (unobservable) psychological
construct
- E.g. degree of depression ---> response to item ‘i feel sad’
- Try to determine degree of depression based on OBSERVABLES / BEHAVIOUR
(e.g.responses to questionnaire items)

- Theoretical leap / discussion to go from unobservable to observable (is it really true?)

● Test of observable contract depends on observable behaviour that is sensitive to the
psychological construct (want to measure something that people VARY on)
(e.g. level of depression, intelligence, etc)

● Determined in a systematic way (e.g. responses to test items / questionnaire /
observe people / reaction time test)

● Use psychological tests for the purpose of making comparisons
- Between different people (interindividual differences) (compare people)
E.g. roger has higher self esteem that Raff
- Within people (intra-individual differences) (see if therapy is effective)
E.g. Lola was less depressed after therapy than before therapy

Psychological test = systematic behaviour sample

● How do we give interpretation to our psychological measures?

E.g. depression questionnaire consists of 10 items (do you cry a lot, sleep well,etc)
- What if: I answer ‘yes’ to 9 items? Seems high, but can you say it's high?
- What if: everyone answers ‘yes’ to all items? Seems low, no variation (questions
aren’t sensitive enough, threshold is too low, can't say anything about depression)
- What if: I answer ‘yes’ to 4 items, and someone else answers ‘yes’ to 8 items? Higher
scores seem more depressed, but is it true? What kind of items? Can we have the
same interpretation? Is difference arbitrary? How large is the difference?
- What if: I answer ‘yes’ to 5 items, and the average score is 2.3? Or 5.6? Higher /
lower than the average, how high / low?

, - You need a REFERENCE, INSURANCE OF CONTENTS, AVERAGE, SPREAD,
NUMBER OF SCORES

Scaling

- The way numerical values are assigned to psychological attributes
- Process of assigning numerals to the psychological attribute (to arrive at test score)
- How is a test score or category determined from the observables? (e.g. item
responses?)
- What values do you give to categories and what is the interpretation of values in
relation to the psychological attribute?

Properties of numerals ↔ measurement level
- Determines how we can use numerals for calculations

Scales of Measurement


Measurement Level Property of Numerals

Nominal Identity

Ordinal Identity and Order

Interval Identity and Order and Quantity

Ratio Identity and Order and Quantity and
Absolute zero


- Identity, it should be exhaustive and exclusive (select only 1 category, at least 1)
- Interval, unit of measurement
- Ratio, has to have ALL of the properties

- Determine kind of calculations you can do with scores

Interpretation of test scores

● Test: systematic behaviour sample
E.g. set of 10 self-response items (score 1-5)

● Scaling: assigning quantitative test score
E.g. sum of item responses (10-50)

● Norming: interpretation of test scores (use a reference to group / absolute norm)
E.g. James scores 22. What does that mean?

➔ How does james’ score of 22 compare to:
- Scores of relevant others? ---> RELATIVE NORMING
- To a fixed standard? ---> ABSOLUTE NORMING

, ● Distribution of test scores
- What information does it give?

● What is the meaning of James’ creativity score of 22?
- Depends on distribution (reference group matters, can give interpretation)
- Even if the mean is the same, spread may differ
- Standard deviations used to calculate z score

Standard score Z

● Number of standard deviations from the mean
● Both positive and negative values (positive = above mean, negative = below mean)
● Mean = 0, SD = 1


Z = specific score - mean of distribution / standard deviation of distribution

1) James Z score: (22 - 25) / 1 = -3
- So he scores 3 SD below average

2) James Z score: (22 - 25) / 5 = -0.6
- So he scores 0.6 SD below average

What does the standard deviation mean?

● We assume all psychological constructs follow a normal distribution
- Most people would fall around the mean
- Meaningful for giving interpretation of how extreme a score is
- Used also for outlier detection

, Is a standard deviation of 1 intuitive? Is it easy to interpret? Should we use different standard
deviations?

Converted Standard Score Tx

● Easier to understand / ‘friendlier’ than Z-scores
● Only positive values, has no zero or negative values
● Mean = 50, SD = 10


T = 10 x Z-score + 50

1) James T-score: 10 x -3 + 50 = 20
- Scores lower than the average

2) James T-score: 10 x -0.6 + 50 = 44
- Quite close to the mean

Percentile Ranks: Px

● Percentage of scores that are below or equal to a specific test score
- E.g. for X = 10, the percentile rank is the percentage of people with score 10
or less = up to and including 10

Conversion X ---> Px

Use frequencies of test scores (how many people have a kind of test score)

● Relative position of score X
● In ordered distribution of observed scores (how many of total sample have this score
or lower)
● = cumulative frequency of score X

E.g.
Score Frequency

0 20

1 20

2 20

3 20

4 20

The benefits of buying summaries with Stuvia:

Guaranteed quality through customer reviews

Guaranteed quality through customer reviews

Stuvia customers have reviewed more than 700,000 summaries. This how you know that you are buying the best documents.

Quick and easy check-out

Quick and easy check-out

You can quickly pay through credit card or Stuvia-credit for the summaries. There is no membership needed.

Focus on what matters

Focus on what matters

Your fellow students write the study notes themselves, which is why the documents are always reliable and up-to-date. This ensures you quickly get to the core!

Frequently asked questions

What do I get when I buy this document?

You get a PDF, available immediately after your purchase. The purchased document is accessible anytime, anywhere and indefinitely through your profile.

Satisfaction guarantee: how does it work?

Our satisfaction guarantee ensures that you always find a study document that suits you well. You fill out a form, and our customer service team takes care of the rest.

Who am I buying these notes from?

Stuvia is a marketplace, so you are not buying this document from us, but from seller gaiaantico. Stuvia facilitates payment to the seller.

Will I be stuck with a subscription?

No, you only buy these notes for $6.47. You're not tied to anything after your purchase.

Can Stuvia be trusted?

4.6 stars on Google & Trustpilot (+1000 reviews)

67096 documents were sold in the last 30 days

Founded in 2010, the go-to place to buy study notes for 14 years now

Start selling
$6.47  2x  sold
  • (0)
  Add to cart