100% satisfaction guarantee Immediately available after payment Both online and in PDF No strings attached
logo-home
Lecture notes Introduction to Data Science Supervised learning (lecture 1-5) (UvT) $3.21
Add to cart

Class notes

Lecture notes Introduction to Data Science Supervised learning (lecture 1-5) (UvT)

 51 views  0 purchase
  • Course
  • Institution

Study: Bachelor Psychology Tilburg University Major/minor: Psychological Methods and Data Science/Applied Advanced Research Methods Course: Introduction to Data Science 2020/2021 (jaar 3) Professor: Kyle Lang Based on: Lectures and slides This course is divided in two parts: 1. Supervised l...

[Show more]
Last document update: 3 year ago

Preview 4 out of 51  pages

  • April 29, 2021
  • September 30, 2021
  • 51
  • 2020/2021
  • Class notes
  • Kyle lang
  • 1 t/m 5
avatar-seller
Lecture notes Supervised learning
Course: Introduction to Data Science 2021/2022
Study: Bachelor Psychology Tilburg University
Lecture 1
The meaning of Data Science
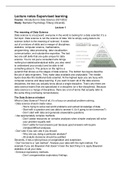
Data science is a buzzword: everyone in the world is looking for a data scientist. It’s a
hot topic. Data science is not the science of data. We’re simply using data to do
science (which is the meaning of science). It exists
out of a mixture of skills and a merger of disciplines:
statistics, computer science, mathematics,
programming, data processing, data visualization,
communication, and substantive expertise. The last
two are soft skills that are quite unique for data
science. You’re not just a consultant who brings
nothing but statistical/analytical skills; you also need
to understand your product and be able to tell
something about it. The picture on the right is a
pyramid that shows us the stages of data science. The bottom two layers describe
the job of data engineers. They make data available and analysable. The middle
layers describe the traditional data scientist. At the highest layer you are busy with
computer science and deep learning. If you want to learn all of the data science
disciplines, the less you actually know about a single discipline. That’s why there are
data science teams that are specialized in a discipline (or a few disciplines). Because
data science is a merge of disciplines, there are a lot of terms that actually refer to
the same thing (confusing nomenclature).
The Data Science mindset
What is Data Science? First of all, it’s a focus on practical problem solving.
- Data science should create value.
- We’re trying to solve real world problems and extract knowledge of data.
- Start with a question and use data to answer it. (Is it going to rain tomorrow?)
- Don’t start with data and generate answerable questions.
- Use appropriately complex methods.
- Don’t waste resources on complex analyses when simpler analyses will solve
your problem equally well.
- Don’t settle for bad answers just because good answers will require
complex/difficult analyses.
- Don’t ask if you can; ask if you should.
- Why are you doing a particular analysis?
- All analytic decisions should be justified.
Secondly, it has a strong focus on pragmatism and scepticism.
- Don’t be tied to a “pet method”. Analyse your data with the right method. For
example if you are Bayesian that doesn’t mean the best thing is to apply Bayesian
statistics on all your data.
- Embrace exploratory methods.
- Don’t overgeneralize exploratory findings.

,- Treat neither data nor theory as sacred.
- Don’t sanctify theory in the face of (definitively) contradictory data.
- Don’t blithely let data overrule well-supported theory.
- Trust no one.
- Not data, other people, or yourself.
- Check and double check.
- Don’t assume what can be tested.
- When in doubt, take the conservative approach.
- Document everything! (syntax)
Lastly, it’s a fast-paced, curious, open-minded attitude.
- Iterate quickly, fail quickly: if you’re trying something new, make sure you fail fast.
Because if it’s not going to work, you want to know sooner, rather than later.
- Never stop learning.
- Learn and use new methods.
- Always remain open to new ideas/approaches.
- Don’t be afraid to tackle new problems.
- Generalize and extend what you know.
- Don’t stagnate.
- Show an appropriate degree of humility.
- You don’t know everything. Embrace and correct your ignorance.
- Ask questions. Communicate and don’t just talk.

, Data Science workflow
This is a representation of the Research
cycle used for empirical research in
most of the sciences:


And this is the Data Science Cycle (O’Neill & Schutt, 2014). The grey circles must
occur in every data analysis! A data product is something you deploy to the world,
like a spam filter for example. EDA finds problems in your data, that you need to fix in
the previous circles/steps. If you already have clean data, EDA is not necessary and
you can go straight to modeling or to report findings (if you just want to show data
and don’t do any analysis).
Data Science novelties
In the social and behavioural sciences, we are accustomed to analysing small,
rectangular datasets. The rows represent observational units, like individuals, and the
columns represent the variables. Data science deals with much more diverse data:
- Relational databases: like an access database or a sequel database. The idea is
that you have a bunch of different rectangular data sets, but they’re not joint together.
For example, you have a dataset for men and for females.
- Data streams: are becoming more common in psychology. You have data
continuously coming in. The data set is not fixed and you have new information
coming in, in real time.
- Web logs: these are data that are immediately logged. Like browsing history,
purchasing history etcetera.
- Sensor data
- Image data: usually kind of rectangular. An image can be broken into pixels and
each pixel has a certain saturation. The saturation has a certain number, so a picture

, van be broken into a set of numbers (rectangular).
- Unstructured text: text that you have on a page. Computational linguistics analyse
unstructured text.
These datasets are often much larger and less structured than those traditionally
analysed in the social and behavioural sciences. When dealing with large amounts of
(distributed) data, we should move the data as little as possible. Data is often
distributed: the data is stored on different computers, different servers. We can
analyse distributed data in situ (where they at) without moving them to a central
computer. You run the results at every location and move the partial results, instead
of the data (distributed computing). When executing long-running jobs, we should try
to split the calculations into smaller pieces that can be executed simultaneously, also
known as parallel processing. This way of processing has two options:
embarrassingly parallel (it’s not more work to run the data in parallel) en multi-
threading (advanced form of parallel processing). We can distribute embarrassingly
parallel jobs directly, there’s no real need for clever task partitioning. Multi-threaded
jobs need to be broken into independent subtasks. Independent means that the
analysation of subtasks doesn’t need to wait for the results of another to be executed
(it needs to run simultaneously). There are several technologies that can facilitate
multi-threading and help you with splitting up the data:
- Small scale (not very big distributed data): Message Passing Interface (MPI) and
Open Multi Processing (OpenMP).
- Large Scale (big data): Google’s MapReduce algorithm, Apache Hadoop and
Apache Spark.
Example embarrassing parallel processing
Run a Monte Carlo simulation to test the central limit
theorem: this basically says that the sum/mean of a
sequence of independent, random variables is going to
approach a normal distribution as the sum/mean gets
larger. So if you have a certain amount of individuals for
example you can assume that your distribution is a normal
distribution.
- Population model: xp ∼ Γ(0.5,1.0) (gamma distribution, as
you can see in the picture on the right it’s not normally
distributed or even close to that)
- Parameters: P ∈ {1,2,...,50} and N ∈ {5,10,...,100}
p
- Mean score for the nth row: x̄ n = P−1 Σ xnp
p=1
- Outcome: KS statistic testing if x̄ n is normally distributed
The first thing we need to do is to define a function to run one replication of the
simulation:

The benefits of buying summaries with Stuvia:

Guaranteed quality through customer reviews

Guaranteed quality through customer reviews

Stuvia customers have reviewed more than 700,000 summaries. This how you know that you are buying the best documents.

Quick and easy check-out

Quick and easy check-out

You can quickly pay through credit card or Stuvia-credit for the summaries. There is no membership needed.

Focus on what matters

Focus on what matters

Your fellow students write the study notes themselves, which is why the documents are always reliable and up-to-date. This ensures you quickly get to the core!

Frequently asked questions

What do I get when I buy this document?

You get a PDF, available immediately after your purchase. The purchased document is accessible anytime, anywhere and indefinitely through your profile.

Satisfaction guarantee: how does it work?

Our satisfaction guarantee ensures that you always find a study document that suits you well. You fill out a form, and our customer service team takes care of the rest.

Who am I buying these notes from?

Stuvia is a marketplace, so you are not buying this document from us, but from seller melissauvt. Stuvia facilitates payment to the seller.

Will I be stuck with a subscription?

No, you only buy these notes for $3.21. You're not tied to anything after your purchase.

Can Stuvia be trusted?

4.6 stars on Google & Trustpilot (+1000 reviews)

55628 documents were sold in the last 30 days

Founded in 2010, the go-to place to buy study notes for 14 years now

Start selling
$3.21
  • (0)
Add to cart
Added