100% satisfaction guarantee Immediately available after payment Both online and in PDF No strings attached
logo-home
Samenvatting integratie-oefeningen statistiek voor de gezondheidszorg: data-analyse $6.74
Add to cart

Summary

Samenvatting integratie-oefeningen statistiek voor de gezondheidszorg: data-analyse

 58 views  0 purchase
  • Course
  • Institution

Integratie-oefeningen statistiek: oefeningen volledig opgelost met uitleg van in de les. Dit zijn herhalingsoefeningen over leerstof uit de volledige cursus --> In bundel kopen voor volledige samenvatting statistiek

Preview 2 out of 11  pages

  • May 4, 2021
  • 11
  • 2020/2021
  • Summary
avatar-seller
, Oefening 1
Stap 1: variabelen definiëren
Voedingsgedrag: kwantitatieve variabele
Leeftijd: kwalitatieve variabele (jongste groep – oudste groep)
Geslacht: kwalitatieve variabele

Stap 2: frequenties laten lopen van alle variabelen en checken op fouten
à Voedingsgedrag heeft een score tussen 3 en 25.
à Score ‘29’ bij voedingsgedrag klopt niet: definiëren als ‘missing variable’

Stap 3: Test uitvoeren
Two-way ANOVA

Stap 4: resultaten
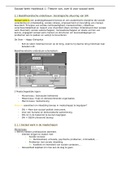
- Interactie-effect: F 11,17 P 0,001 => Significant interactie-effect
- Plots interpreteren:
Bij een significant interactie-effect moet je de plot overtekenen!
De score op voedingsgedrag is bij de jongens het laagste bij de oudste groep en het hoogste bij de
jongste groep.
Bij de meisjes scoren de jongste meisjes het slechtste op voedingsgedrag, de oudste meisjes scoren
daar het beste.
- Gemiddeldes:
De jongste groep bij de jongens scoort gemiddeld 12,86 sd 4,61. De oudste groep jongens
gemiddeld 9,33 sd 5,32.
De jongste meisjes scoren gemiddeld 7,50 sd 2,98. De oudste meisjes gemiddeld 11,44 sd 3,17.


Oefening 2
Stap 1: variabelen definiëren
Bewegingsgedrag: kwantitatieve variabele
Voedingsgedrag: kwantitatieve variabele
Groep: Kwalitatieve variabele

Stap 2: frequenties laten lopen van alle variabelen en checken op fouten

Stap 3: Test uitvoeren
One-Way-ANOVA 2x uitvoeren

Stap 4: resultaten
Bewegingsgedrag
Groep 1: Gemiddeld 13,41 sd 2,83
Groep 2: gemiddeld 13,25 sd 5,08
Groep 3: Gemiddeld 12,26 sd 4,59

Levene’s test: F 1,16 P 0,32. => Levene’s test is niet significant.

ANOVA: F 0,44 P 0,64 => Er is geen significant verschil in bewegingsgedrag volgens de 3 groepen.

Voedingsgedrag
Groep 1: Gemiddeld 9,54 sd 2,75
Groep 2: Gemiddeld 10,83 sd 4,67
Groep 3: Gemiddeld 12,83 sd 4,94

The benefits of buying summaries with Stuvia:

Guaranteed quality through customer reviews

Guaranteed quality through customer reviews

Stuvia customers have reviewed more than 700,000 summaries. This how you know that you are buying the best documents.

Quick and easy check-out

Quick and easy check-out

You can quickly pay through credit card or Stuvia-credit for the summaries. There is no membership needed.

Focus on what matters

Focus on what matters

Your fellow students write the study notes themselves, which is why the documents are always reliable and up-to-date. This ensures you quickly get to the core!

Frequently asked questions

What do I get when I buy this document?

You get a PDF, available immediately after your purchase. The purchased document is accessible anytime, anywhere and indefinitely through your profile.

Satisfaction guarantee: how does it work?

Our satisfaction guarantee ensures that you always find a study document that suits you well. You fill out a form, and our customer service team takes care of the rest.

Who am I buying these notes from?

Stuvia is a marketplace, so you are not buying this document from us, but from seller MBGZHZ. Stuvia facilitates payment to the seller.

Will I be stuck with a subscription?

No, you only buy these notes for $6.74. You're not tied to anything after your purchase.

Can Stuvia be trusted?

4.6 stars on Google & Trustpilot (+1000 reviews)

52510 documents were sold in the last 30 days

Founded in 2010, the go-to place to buy study notes for 14 years now

Start selling
$6.74
  • (0)
Add to cart
Added