100% satisfaction guarantee Immediately available after payment Both online and in PDF No strings attached
logo-home
Samenvatting Stap voor stap Handelingen Spss 17/20 $6.20   Add to cart

Summary

Samenvatting Stap voor stap Handelingen Spss 17/20

 32 views  3 purchases
  • Course
  • Institution
  • Book

duidelijk docu met de letterlijke stappen neergeschreven. 17/20 Door dit plan te volgen. Je moet enkel weten wat voor soort vraag het is en welke soort variabelen gebruikt worden.

Preview 2 out of 5  pages

  • No
  • 3 - ...
  • May 17, 2021
  • 5
  • 2020/2021
  • Summary
avatar-seller
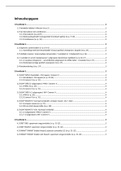
Inhoudsopgave
1 Hoofdstuk 3................................................................................................................................................ 2
1.1 Variabele indelen in klassen (sv p.5)...............................................................................................................2
1.2 Van hercoderen tot combineren.....................................................................................................................2
1.2.1 Hercoderen (sv p.8-9).............................................................................................................................2
1.2.2 Betrouwbaarheid/ homogeniteit (Cronbach alpha) (sv p. 9-10)............................................................2
1.2.3 Combineren (sv p. 10).............................................................................................................................2

2 Hoofdstuk 4................................................................................................................................................ 2
2.1 Gegevens samenvatten (sv p.13-14)..............................................................................................................2
2.1.1 Spreiding (metrisch/kwantitatief niveau) grafisch weergeven: boxplot (sv p.14).................................2
2.2 Multiple respons/ meervoudige antwoorden (1 variabele in 1 steekproef) (sv p.16)....................................2
2.3 1 variable in versch steekproeven/ subgroepen beschrijven (splitten) (sv p.16-17).......................................3
2.3.1 2 analyses integreren – verschillende subgroepen in zelfde tabel - crosstabel (sv p.17)......................3
2.3.2 Kolompercentage grafisch weergeven (sv p.17)....................................................................................3
2.4 Kansberekening (sv p. 19)...............................................................................................................................3

3 Hoofdstuk 5................................................................................................................................................ 3
3.1 NOM*NOM: Kruistabel + CHI square  Cramers V...........................................................................................3
3.1.1 Kruistabel + CHI square (sv p. 23-24)......................................................................................................3
3.1.2 Cramers V (sv p. 31)................................................................................................................................3
3.2 NOM*ORD (2 subgroepen): MWU  Cramers V...............................................................................................4
3.2.1 MWU (sv p. 25).......................................................................................................................................4
3.2.2 Cramers V (sv p. 31)................................................................................................................................4
3.3 NOM*ORD (>2 subgroepen): KW  Cramers V.................................................................................................4
3.3.1 KW (sv p. 26)...........................................................................................................................................4
3.3.2 Cramers V (sv p. 31)................................................................................................................................4
3.4 NOM*KWANT (Y normaal verdeeld): compare means  èta + éta2................................................................4
3.4.1 Compare means (sv p. 27)......................................................................................................................4
3.4.2 Èta & éta2 interpretatie (sv p. 28)..........................................................................................................4
3.5 NOM*KWANT (Y niet. Normaal verdeeld):.....................................................................................................4
3.5.1 2 subgroepen: MWU  Cramers V............................................................................................................4
3.5.2 >2 subgroepen: KW  Cramers V..............................................................................................................4

4 Hoofdstuk 6................................................................................................................................................ 5
4.1 ORD*ORD: spearman rangcorrelatie (sv p. 31-32).........................................................................................5
4.2 ORD*KWANT: spearman rangcorrelatie (sv p. 31-32)...................................................................................5
4.3 KWANT*KWANT (Indien lineair): pearson correlatie (r2) (sv p. 31-32)..........................................................5
4.4 KWANT*KWANT (Indien niet lineair): spearman rangcorrelatie (sv p. 31-32)...............................................5

, 1 Hoofdstuk 3
1.1 Variabele indelen in klassen (sv p.5)
Transform  Record into Different Variables (op deze manier zal je oude nog blijven
bestaan)  selecteer de nodige variabele (leeftijd)  en deze variabele een naam geven 
druk dan op change  vervolgens klikje op old and new changes  of wel klik je dan bereik
of bereik, lowest trough value (typ hier 20) en bij value klik je 1 en toevoegen  volgende
waarde zal je toevoegen bij range namelijk 21-30 en dit geef je value 2  enz…  als je dit
hebt druk je op continue  ok

LFTKLAS staat nu in je Variable view  vergeet je decimalen, MEETNIVEAU EN VALUES niet
aan te passen!!
1.2 Van hercoderen tot combineren
1.2.1 Hercoderen (sv p.8-9)
Transform  Recode into different values  glk2 wordt rglk2 (r = recode)  klik dan op old
and new values  klik op continue  klik op OK
1.2.2 Betrouwbaarheid/ homogeniteit (Cronbach alpha) (sv p. 9-10)
Analyze  scale  Reliability analyzes  selecteer de 5 variabelen  ga dan naar statistics
 duidt scale en scale if item deleted aan
1.2.3 Combineren (sv p. 10)
Totaal:
Transform  compute variabel  tel de nodige variabelen op (zie foto)  Min3 – Max15 
tussen 3 en 8 ongelukkig, tussen 9 en 15 gelukkig
Gemiddelde:
Transform  compute variabel  kies bij functionans and special variabels op mean

Tot & gem komen op scale te staan!

2 Hoofdstuk 4
2.1 Gegevens samenvatten (sv p.13-14)
Analyze  Descriptive Analyze  Frequencies  statistics  afhankelijk van meetniveau
centrum en/ of spreidingsparameters aanduiden

Nominaal: enkel modus
Ordinaal: modus en mediaan
Metrisch/kwantitatief: modus, mediaan, gemiddelde, range, standaardafwijking,
interkwartielafstand (percentage 25, 50, 75)
2.1.1 Spreiding (metrisch/kwantitatief niveau) grafisch weergeven: boxplot
(sv p.14)
Graphs  Chart builder  Boxplot aanklikken  klik de eerste versie aan  dubbelklik of
sleep dit naar het witte vak  versleep de variabelen naar de y-as  klik dan op OK
2.2 Multiple respons/ meervoudige antwoorden (1 variabele in 1
steekproef) (sv p.16)
Analyze  Multiple Response  Define Variable Sets…  variabelen naar Variables in set 
naam toevoegen ‘GELD’  counted value = 1  klik op ADD/pijltje in midden  ga opnieuw
naar Analyze,

2

The benefits of buying summaries with Stuvia:

Guaranteed quality through customer reviews

Guaranteed quality through customer reviews

Stuvia customers have reviewed more than 700,000 summaries. This how you know that you are buying the best documents.

Quick and easy check-out

Quick and easy check-out

You can quickly pay through credit card or Stuvia-credit for the summaries. There is no membership needed.

Focus on what matters

Focus on what matters

Your fellow students write the study notes themselves, which is why the documents are always reliable and up-to-date. This ensures you quickly get to the core!

Frequently asked questions

What do I get when I buy this document?

You get a PDF, available immediately after your purchase. The purchased document is accessible anytime, anywhere and indefinitely through your profile.

Satisfaction guarantee: how does it work?

Our satisfaction guarantee ensures that you always find a study document that suits you well. You fill out a form, and our customer service team takes care of the rest.

Who am I buying these notes from?

Stuvia is a marketplace, so you are not buying this document from us, but from seller thomasjuvyns. Stuvia facilitates payment to the seller.

Will I be stuck with a subscription?

No, you only buy these notes for $6.20. You're not tied to anything after your purchase.

Can Stuvia be trusted?

4.6 stars on Google & Trustpilot (+1000 reviews)

72841 documents were sold in the last 30 days

Founded in 2010, the go-to place to buy study notes for 14 years now

Start selling
$6.20  3x  sold
  • (0)
  Add to cart