100% satisfaction guarantee Immediately available after payment Both online and in PDF No strings attached
logo-home
Samenvatting Analyse Van De Marktgegevens 18/20! (MKM14a) $5.36
Add to cart

Summary

Samenvatting Analyse Van De Marktgegevens 18/20! (MKM14a)

2 reviews
 50 views  3 purchases
  • Course
  • Institution

Gestructureerde en volledige samenvatting van de lessen van analyse van de marktgegevens + notities gastcolleges (nielsen en gfk), gegeven door C. Billen in het tweede semester van het eerste jaar KMO& ondernemen UCLL (Leuven)

Last document update: 3 year ago

Preview 2 out of 22  pages

  • June 2, 2021
  • June 2, 2021
  • 22
  • 2020/2021
  • Summary

2  reviews

review-writer-avatar

By: maiteschelkens • 1 year ago

review-writer-avatar

By: vrankenproracer • 3 year ago

avatar-seller
ANALYSE VAN MARKTGEGEVENS
TOPIC 1: CORRELATIE, REGRESSIE EN TIJDSREEKSEN
1. Correlatie- en regressieanalyse
A. Correlatieanalyse
B. Determinatiecoëfficiënt
C. Regressieanalyse
2. Tijdsreeksen
A. Voortschrijdend gemiddelde
B. Trendberekening
3. Oefeningen

1) CORRELATIE- EN REGRESSIEANALYSE
A. Correlatieanalyse
 Verband tussen twee variabelen X en Y nagaan
 X onafhankelijke variabele, Y afhankelijke variabele
 Verband of statistische samenhang  correlatiecoëfficiënt = r
 -1 ≤ r ≤ +1
 r = -1  perfect negatief verband
r = +1  perfect positief verband
r = 0  geen verband

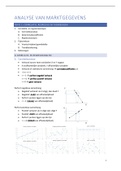
Perfect negatieve samenhang
 Negatief verband: als X stijgt, dan daalt Y
 Negatief: AARD van afhankelijkheid
 Perfect: punten liggen op één lijn
 r = -1 (GRAAD van afhankelijkheid)

Perfect positieve samenhang
 Positief verband: als X stijgt dan stijgt Y
 Positief: AARD van afhankelijkheid
 Perfect: punten liggen op één lijn
 r = +1 (GRAAD van afhankelijkheid)


1

,  Hoe dichter |r| bij 1 ligt, hoe sterker het verband
 |r| > 0,8  sterk verband
0,4 < |r|< 0,8  zwak/matig verband
|r| < 0,4  geen verband

Verband versus oorzakelijkheid
 Verbanden zijn niet noodzakelijk causale (oorzakelijke) verbanden
 Verband betekent niet dat de ene variabele de oorzaak is van de andere!

In Excel
 Statistische functie CORRELATIE berekent de correlatiecoëfficiënt van 2 gegevensreeksen.
 Zien of het een sterk, matig of geen verband is

B. Determinatiecoëfficiënt = r²
 = Hoeveel procent van de wijzigingen van de afhankelijke variabele Y wordt verklaard door
de onafhankelijke variabele X?
 r² = kwadraat van correlatiecoëfficiënt
 0 <= r² <= 1
 r² <= 100%

C. Regressieanalyse
 We berekenen een rechte (lineair verband) die de samenhang weergeeft tussen de
onafhankelijke en de afhankelijke variabele.
 Lineaire regressie: Y = a+bX
 Parameter a = de constante factor of het intercept op de Y-as
 Parameter b = de richtingscoëfficiënt of de helling van de rechte

In Excel
 Statistische functie VOORSPELLEN.LINEAR
 Kan ook berekend worden met de functie TREND (Ctrl Shift Enter!!)


2) TIJDSREEKSEN
A. Inleiding
 Tijdreeksen: evolutie van een variabele doorheen de tijd
 Seizoenschommelingen:
 Zeer korte termijnschommelingen (minder dan 1
jaar)
 Patroon herhaalt zich
 Seizoenen of sociale gewoonten
 Conjunctuurbeweging: tendensen op middellange of lange termijn
 Trend: beweging die door de conjunctuur loopt en de evolutie weergeeft op lange termijn


2

The benefits of buying summaries with Stuvia:

Guaranteed quality through customer reviews

Guaranteed quality through customer reviews

Stuvia customers have reviewed more than 700,000 summaries. This how you know that you are buying the best documents.

Quick and easy check-out

Quick and easy check-out

You can quickly pay through credit card or Stuvia-credit for the summaries. There is no membership needed.

Focus on what matters

Focus on what matters

Your fellow students write the study notes themselves, which is why the documents are always reliable and up-to-date. This ensures you quickly get to the core!

Frequently asked questions

What do I get when I buy this document?

You get a PDF, available immediately after your purchase. The purchased document is accessible anytime, anywhere and indefinitely through your profile.

Satisfaction guarantee: how does it work?

Our satisfaction guarantee ensures that you always find a study document that suits you well. You fill out a form, and our customer service team takes care of the rest.

Who am I buying these notes from?

Stuvia is a marketplace, so you are not buying this document from us, but from seller MK2002. Stuvia facilitates payment to the seller.

Will I be stuck with a subscription?

No, you only buy these notes for $5.36. You're not tied to anything after your purchase.

Can Stuvia be trusted?

4.6 stars on Google & Trustpilot (+1000 reviews)

53340 documents were sold in the last 30 days

Founded in 2010, the go-to place to buy study notes for 14 years now

Start selling
$5.36  3x  sold
  • (2)
Add to cart
Added