100% satisfaction guarantee Immediately available after payment Both online and in PDF No strings attached
logo-home
Statistics for CSAI 1 $8.06
Add to cart

Class notes

Statistics for CSAI 1

 78 views  5 purchases
  • Course
  • Institution
  • Book

Lecture notes study book Learning Statistics with R of Navarro, Daniel - ISBN: 9781326189723

Preview 3 out of 27  pages

  • June 4, 2021
  • 27
  • 2020/2021
  • Class notes
  • Dr. peter hendrix
  • All classes
avatar-seller
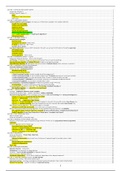
Lecture 1 is an informative session about the course structure

Chapter 1- Book
Why do we learn statistics?
- we don’t trust humans // Biases
- when people are presented with a strong argument that contradicts our pre-existing
beliefs, we find it pretty hard to even perceive it to be a strong argument
- Simpson’s Paradox

Chapter 2 - Book
A brief introduction to research design
- Data collection can be thought of as a kind of measurement.
- operationalisation is the process by which we take a meaningful but somewhat vague
concept, and turn it into a precise measurement.
- A theoretical construct. This is the thing that you’re trying to take a measurement of,
like “age”, “gender” or an “opinion”. A theoretical construct can’t be directly
observed, and often they’re actually a bit vague.
- A measure. The measure refers to the method or the tool that you use to make your
observations.
- An operationalisation. It refers to the logical connection between the measure and
the theoretical construct, or to the process by which we try to derive a measure from a
theoretical construct.
- A variable. It is what we end up with when we apply our measure to something in the
world. That is, variables are the actual “data” that we end up with in our data sets.

Scales of measurement
- A nominal scale variable (categorical variable) is one in which there is no particular
relationship between the different possibilities: for these kinds of variables it doesn’t
make any sense to say that one of them is “bigger’ or “better” than any other one, and
it absolutely doesn’t make any sense
- An ordinal scale variable is one in which there is a natural, meaningful way to order
the different possibilities, but you can’t do anything else.e to average them.
- In the case of interval scale variables, the differences between the numbers are
interpretable, but the variable doesn’t have a “natural” zero value.
- ratio scale you can do real calculations with it


- A continuous variable is one in which, for any two values that you can think of, it’s
always logically possible to have another value in between.
- A discrete variable is, in effect, a variable that isn’t continuous. For a discrete
variable, it’s sometimes the case that there’s nothing in the middle.

, - Likert Scale- we can’t say an exact thing about it-- quasi-interval scale.


- reliability (repeatability or consistency of your measurement) of a measure tells you
how precisely you are measuring something, whereas the validity (correctness of a
measurement) of a measure tells you how accurate the measure is
- Test-retest reliability. This relates to consistency over time: if we repeat the
measurement at a later date, do we get the same answer?
- Inter-rater reliability. This relates to consistency across people: if someone
else repeats the measurement will they produce the same answer?
- Parallel forms reliability. This relates to consistency across
theoretically-equivalent measurements: if I use a different set of bathroom
scales to measure my weight, does it give the same answer?
- Internal consistency reliability. If a measurement is constructed from lots of
different parts that perform similar functions (e.g., a personality questionnaire
result is added up across several questions) do the individual parts tend to give
similar answers.


- Internal validity: extent to which you are able draw the correct conclusions
about the causal relationships between variables.
- External validity: generalisability of the study
- Construct validity: a question of whether you’re measuring what you want to
be mea- suring. A measurement has good construct validity if it is actually
measuring the correct theoretical construct,
- Face validity: whether or not a measure “looks like” it’s doing what it’s
supposed to.
- Ecological validity: for EV the entire set up of the study should closely
approximate the real world scenario that is being investigated


Threats to validity
- Confound: A confound is an additional, often unmeasured variable that turns out to be
related to both the predictors and the outcomes. The existence of confounds threatens
the internal validity of the study because you can’t tell whether the predictor causes
the outcome, or if the confounding variable causes it, etc.
- Artifact: A result is said to be “artifactual” if it only holds in the special situation that
you happened to test in your study. The possibility that your result is an artifact
describes a threat to your external validity, because it raises the possibility that you
can’t generalise your results to the actual population that you care about.

, - History effects---specific events may occur during the study itself that might influence
the outcomes.
- repeated testing effects
- Maturation effects-- how people change on their own over time: we get older, we get
tired, we get bored, etc.


- selection bias
- differential attrition, a kind of selection bias, that is caused by the study itself.
- regression to mean
- experimenter bias--solution double blind studies
- pygmalion effect-the expectations become a self-fulfilling prophecy.
- Hawthorne effect: people alter their performance because of the attention that the
study focuses on them.


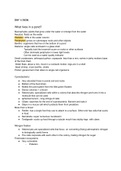
Lecture 3
Descriptive Statistics

- There is two types of statistics: Inferential and descriptive
- DS is a way to characterize some data we have collected (our sample) without
attempting to go beyond that data (to understand a population)
- Only what the data show
- Includes:
- Measures of central tendency (where is most of the data concentrated,
middle?)
- Measures of dispersion (how spread out are the data?)
- Features of the distribution (what is the shape of the distribution?)


- In statistics we fit models to our data
- we use a statistical model to represent what is happening in the real world
- The mean is a hypothetical value
- it doesn’t have to be a value that actually exists in the data set
- As such, the mean is simple statistical model
- outcome i = (model) + error i

The benefits of buying summaries with Stuvia:

Guaranteed quality through customer reviews

Guaranteed quality through customer reviews

Stuvia customers have reviewed more than 700,000 summaries. This how you know that you are buying the best documents.

Quick and easy check-out

Quick and easy check-out

You can quickly pay through credit card or Stuvia-credit for the summaries. There is no membership needed.

Focus on what matters

Focus on what matters

Your fellow students write the study notes themselves, which is why the documents are always reliable and up-to-date. This ensures you quickly get to the core!

Frequently asked questions

What do I get when I buy this document?

You get a PDF, available immediately after your purchase. The purchased document is accessible anytime, anywhere and indefinitely through your profile.

Satisfaction guarantee: how does it work?

Our satisfaction guarantee ensures that you always find a study document that suits you well. You fill out a form, and our customer service team takes care of the rest.

Who am I buying these notes from?

Stuvia is a marketplace, so you are not buying this document from us, but from seller melisanver. Stuvia facilitates payment to the seller.

Will I be stuck with a subscription?

No, you only buy these notes for $8.06. You're not tied to anything after your purchase.

Can Stuvia be trusted?

4.6 stars on Google & Trustpilot (+1000 reviews)

52510 documents were sold in the last 30 days

Founded in 2010, the go-to place to buy study notes for 14 years now

Start selling
$8.06  5x  sold
  • (0)
Add to cart
Added