Statistics Assignment 3 Group 110
Question 1
A. Perform two multiple linear regression analyses to test that PrevR and Size have a
positive relationship with Techsuccess and Ecolsuccess, and that Duration and
Distance have a negative relation with Techsuccess and Ecolsuccess. Explain if the
two regression models are statistically significant (𝜶 = 5%).
Regression model 1 – Dependent variable: Techsuccess
H0 = There is no relationship between PrevR and Size with Techsuccess
There is no relationship between Duration and Distance with Techsuccess
H1 = PrevR and Size have a positive relationship with Techsuccess
Duration and Distance have a negative relationship with Techsuccess
Directed hypothesis, so we use a 90% confidence interval
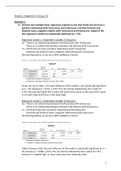
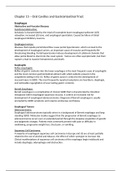
Table 1: Linear Regression ANOVA dependent variable Techsuccess
As we can see in table 1, the joint influence of the model is not statistically significant
at 𝛼 = 5%, because p = 0.011 ≥ 0.05. This can also be explained by the F-value of
3.375, because the higher the F-value, the lower the p-value. In this case, the F-value
is not quite high and thus p is also quite high.
Regression model 2 – Dependent variable: Ecolsuccess
H0 = There is no relationship between PrevR and Size with Ecolsuccess
There is no relationship between Duration and Distance with Ecolsuccess
H1 = PrevR and Size have a positive relationship with Ecolsuccess
Duration and Distance have a negative relationship with Ecolsuccess
Directed hypothesis, so we use a 90% confidence interval
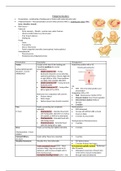
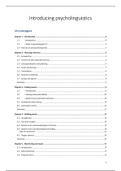
Table 2: Linear Regression ANOVA dependent variable Ecolsuccess
Table 2 shows us that the joint influence of the model is statistically significant at 𝛼 =
5%, because p = 0.006 ≤ 0.05. This can also be indicated by the F-value of 3.721,
because it is slightly high, so the p-value becomes relatively small.
1
, B. Discuss for each variable:
1. If the effects have the expected direction
2. If the effects are statistically significant based on the confidence interval
Do this for both regression models. Use 𝜶 = 5%.
Regression model 1 – Dependent variable: Techsuccess
The results of the coefficients of the multiple linear regression with the dependent
variable Techsuccess are displayed in table 3.
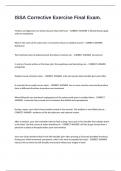
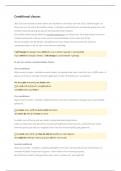
Table 3: Coefficient table multiple linear regression analysis dependent variable Techsuccess
First, we need to determine if the effect of each variable has the expected direction.
For the variable PrevR it was expected to have a positive relationship with
Techsuccess. In table 3, we found a b-coefficient of 0.047 and a 𝛽-coefficient of 0.012,
which is slightly positive. Based on this, we can conclude that the expected direction
is correct. Now we need to determine if this direction is statistically significant. We
can do this by looking at the confidence interval. In table 3, we observed a lower
bound of -0.466 and an upper bound of 0.560 and thus an interval of (-0.466;0.560).
The result is significant if the value of 0 does not lie in the confidence interval. In this
case, the value of 0 is present in the interval meaning that the direction is not
significant. We can confirm this by looking at the p-value. In table 3, the two-tailed p-
value is given, namely p2 = 0.880. We need the one-tailed p-value, so p1 = p2/2 =
0.880/2 = 0.440. This is not statistically significant at 𝛼 = 5%, because 0.440 ≥ 0.05.
Second, we have the variable Duration, whereas it was expected that this variable
has a negative relationship with Techsuccess. If we look at table 3, we found a b-
coefficient of 0.012 and a 𝛽-coefficient of 0.065, which is rather positive. This
indicates that the expected negative direction is incorrect. To determine if this is
significant, we look at the confidence interval. Table 3 gives a lower bound of -0.011
and an upper bound of 0.034, meaning that the interval is (-0.011;0.034). This implies
that the value of 0 is present in the confidence interval and thus that the direction is
not statistically significant. This can be confirmed if we look at the p-value of 0.390.
The one-tailed p-value is 0.390/2 = 0.195 and thus not statistically significant at 𝛼 =
5%, because 0.195 ≥ 0.05.
The third variable is Size. For this variable the expected direction was a positive
relationship with Techsuccess. In table 3, we observed a b-coefficient of 0.093 and a
𝛽-coefficient of 0.129, which are rather positive. Based on this, we can say that the
expected direction is correct. Now we need to know if this direction is significant. If
we look at the confidence interval in table 3, we found a lower bound of 0.001 and an
2
Question 1
A. Perform two multiple linear regression analyses to test that PrevR and Size have a
positive relationship with Techsuccess and Ecolsuccess, and that Duration and
Distance have a negative relation with Techsuccess and Ecolsuccess. Explain if the
two regression models are statistically significant (𝜶 = 5%).
Regression model 1 – Dependent variable: Techsuccess
H0 = There is no relationship between PrevR and Size with Techsuccess
There is no relationship between Duration and Distance with Techsuccess
H1 = PrevR and Size have a positive relationship with Techsuccess
Duration and Distance have a negative relationship with Techsuccess
Directed hypothesis, so we use a 90% confidence interval
Table 1: Linear Regression ANOVA dependent variable Techsuccess
As we can see in table 1, the joint influence of the model is not statistically significant
at 𝛼 = 5%, because p = 0.011 ≥ 0.05. This can also be explained by the F-value of
3.375, because the higher the F-value, the lower the p-value. In this case, the F-value
is not quite high and thus p is also quite high.
Regression model 2 – Dependent variable: Ecolsuccess
H0 = There is no relationship between PrevR and Size with Ecolsuccess
There is no relationship between Duration and Distance with Ecolsuccess
H1 = PrevR and Size have a positive relationship with Ecolsuccess
Duration and Distance have a negative relationship with Ecolsuccess
Directed hypothesis, so we use a 90% confidence interval
Table 2: Linear Regression ANOVA dependent variable Ecolsuccess
Table 2 shows us that the joint influence of the model is statistically significant at 𝛼 =
5%, because p = 0.006 ≤ 0.05. This can also be indicated by the F-value of 3.721,
because it is slightly high, so the p-value becomes relatively small.
1
, B. Discuss for each variable:
1. If the effects have the expected direction
2. If the effects are statistically significant based on the confidence interval
Do this for both regression models. Use 𝜶 = 5%.
Regression model 1 – Dependent variable: Techsuccess
The results of the coefficients of the multiple linear regression with the dependent
variable Techsuccess are displayed in table 3.
Table 3: Coefficient table multiple linear regression analysis dependent variable Techsuccess
First, we need to determine if the effect of each variable has the expected direction.
For the variable PrevR it was expected to have a positive relationship with
Techsuccess. In table 3, we found a b-coefficient of 0.047 and a 𝛽-coefficient of 0.012,
which is slightly positive. Based on this, we can conclude that the expected direction
is correct. Now we need to determine if this direction is statistically significant. We
can do this by looking at the confidence interval. In table 3, we observed a lower
bound of -0.466 and an upper bound of 0.560 and thus an interval of (-0.466;0.560).
The result is significant if the value of 0 does not lie in the confidence interval. In this
case, the value of 0 is present in the interval meaning that the direction is not
significant. We can confirm this by looking at the p-value. In table 3, the two-tailed p-
value is given, namely p2 = 0.880. We need the one-tailed p-value, so p1 = p2/2 =
0.880/2 = 0.440. This is not statistically significant at 𝛼 = 5%, because 0.440 ≥ 0.05.
Second, we have the variable Duration, whereas it was expected that this variable
has a negative relationship with Techsuccess. If we look at table 3, we found a b-
coefficient of 0.012 and a 𝛽-coefficient of 0.065, which is rather positive. This
indicates that the expected negative direction is incorrect. To determine if this is
significant, we look at the confidence interval. Table 3 gives a lower bound of -0.011
and an upper bound of 0.034, meaning that the interval is (-0.011;0.034). This implies
that the value of 0 is present in the confidence interval and thus that the direction is
not statistically significant. This can be confirmed if we look at the p-value of 0.390.
The one-tailed p-value is 0.390/2 = 0.195 and thus not statistically significant at 𝛼 =
5%, because 0.195 ≥ 0.05.
The third variable is Size. For this variable the expected direction was a positive
relationship with Techsuccess. In table 3, we observed a b-coefficient of 0.093 and a
𝛽-coefficient of 0.129, which are rather positive. Based on this, we can say that the
expected direction is correct. Now we need to know if this direction is significant. If
we look at the confidence interval in table 3, we found a lower bound of 0.001 and an
2