100% satisfaction guarantee Immediately available after payment Both online and in PDF No strings attached
logo-home
STA2020 (Applied Statistics) Regression Summary $6.47
Add to cart

Summary

STA2020 (Applied Statistics) Regression Summary

 81 views  1 purchase
  • Course
  • Institution

This is a complete and comprehensive summary of the regression section section of the STA2020 - Applied Statistics course. It contains everything you need to know to fully understand and do well in this section. Ideal for test/exam preparation! The sub-sections covered are an introduction to statis...

[Show more]

Preview 2 out of 18  pages

  • June 22, 2021
  • 18
  • 2020/2021
  • Summary
avatar-seller
STA2020F: Applied Statistics

Regression Notes


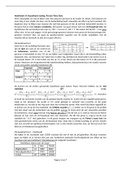
Statistical inference: The attempt to reach a conclusion concerning all members of a
class (population) from observations of only some of them (sample).


Population: A collection of observations.

• Numerical descriptor = A parameter.
• Population size = N.
• Mean (a measure of centre) = .
• Variance (a measure of dispersion) = 2.
• Standard deviation = .


Sample: A part or subset of a population.

• Numerical descriptor = A statistic.
• Sample size = n.
• Sample mean = 𝑥̅ .
• Sample variance = s2.
• Sample standard deviation = s.


Hypothesis testing:

• Define the null hypothesis, H0.
• Define the alternative hypothesis, Ha, where Ha is a form of “not H0”.
• Define the type 1 error (probability of falsely rejecting the null hypothesis), ,
usually 0.05.
𝑥̅ − 𝜇
• Calculate the test statistic. 𝑧 = .
𝜎
• Calculate the p-value (the probability of getting a result “as or more extreme”
than observed if the null hypothesis is true).
• If the p-value is  , reject H0. Otherwise, fail to reject H0.

, Correlation analysis: Measures the strength and direction of the linear relationship
between two variables.


Correlation coefficient

• Population correlation coefficient (p) – Measures the strength of the association
between the variables.
• Sample correlation coefficient (r) – An estimate of p, used to measure the
strength of the linear relationship in the sample observations.
• The sample correlation coefficient (r):


• Unit free.
• Lies between -1 (strong negative relationship) and 1 (strong positive relationship).
• Significance of the correlation coefficient:

The benefits of buying summaries with Stuvia:

Guaranteed quality through customer reviews

Guaranteed quality through customer reviews

Stuvia customers have reviewed more than 700,000 summaries. This how you know that you are buying the best documents.

Quick and easy check-out

Quick and easy check-out

You can quickly pay through credit card or Stuvia-credit for the summaries. There is no membership needed.

Focus on what matters

Focus on what matters

Your fellow students write the study notes themselves, which is why the documents are always reliable and up-to-date. This ensures you quickly get to the core!

Frequently asked questions

What do I get when I buy this document?

You get a PDF, available immediately after your purchase. The purchased document is accessible anytime, anywhere and indefinitely through your profile.

Satisfaction guarantee: how does it work?

Our satisfaction guarantee ensures that you always find a study document that suits you well. You fill out a form, and our customer service team takes care of the rest.

Who am I buying these notes from?

Stuvia is a marketplace, so you are not buying this document from us, but from seller stuviasisters. Stuvia facilitates payment to the seller.

Will I be stuck with a subscription?

No, you only buy these notes for $6.47. You're not tied to anything after your purchase.

Can Stuvia be trusted?

4.6 stars on Google & Trustpilot (+1000 reviews)

51036 documents were sold in the last 30 days

Founded in 2010, the go-to place to buy study notes for 15 years now

Start selling
$6.47  1x  sold
  • (0)
Add to cart
Added