Statistics
Statistics is the Science of collection, organisation, presentation,
analysis and interpretation of the numerical data.
Useful Terms
1. Primary and Secondary Data The data collected by the
investigator himself is known as the primary data, while the
data which are not originally collected but rather obtained from
some sources is known as secondary data.
2. Variable or Variate A characteristics that varies in
magnitude from observation to observation. e.g. weight, height,
income, age, etc are variables.
3. Grouped and Ungrouped Data The data which is organised
into several groups is called grouped data where as ungrouped
data is present in original form, i.e. it is just a list of numbers.
4. Class-Intervals The groups which used to condense the data
are called classes or class-intervals.
5. Limit of the Class The starting and ending values of each
class are called Lower and Upper limits, respectively.
6. Class Size or Class Width The difference between upper and
lower boundary of a class is called size of the class.
7. Class Marks The class marks of a class is given by
Lower limit + Upper limit
.
2
8. Frequency The number of times an observation occurs in the
given data, is called the frequency of the observation.
9. Frequency Distribution It is a tabular summary of data
showing the frequency of observations.
10. Discrete Frequency Distribution A frequency distribution
is called a discrete frequency distribution, if data are presented
in such a way that exact value of the data are clearly shown.
, 11. Continuous Frequency Distribution A frequency
distribution in which data are arranged in classes (or groups)
which are not exactly measurable.
12. Cumulative Frequency Distribution In this type of
distribution, the frequencies of each class intervals are added
successively from top to bottom or from bottom to top.
A cumulative frequency distribution is of two types
(i) Less than cummulative frequency distribution In
this frequencies are added successively from top to bottom
and we represent the cumulative number of observation less
than or equal to the class frequency to which it relates.
(ii) More than cummulative frequency distribution In
this frequencies are added successively from bottom to top
and we represent the cummulative number of observation
greater than or equal to the class frequency to which it
relates.
Graphical Representation of
Frequency Distributions
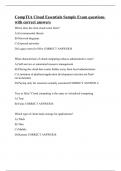
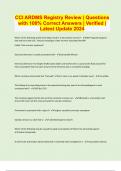
(i) Bar Diagrams In bar diagrams, only the length of the bars
are taken into consideration. To draw a bar diagram, we first
mark equal lengths for the different classes on the horizontal
axis, i.e. on X-axis.
On each of these lengths on the horizontal axis, we erect
(vertical) a rectangle whose heights are proportional to the
frequency of the class.
Y
40
30
Frequency
Bikes
Cars
20
Scooters
Bus
10
0 X
Registered vehicles
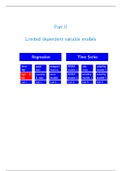
(ii) Histogram To draw the histogram of a given continuous
frequency distribution, we first mark off all the class intervals
along X-axis on a suitable scale. On each of these class intervals
, on the horizontal axis, we erect (vertical) a rectangle whose
height is proportional to the frequency of that particular class,
so that the area of the rectangle is proportional to the frequency
of the class.
Y
50
40
30
Frequency
20
10
0 X
10 20 30 40 50 60
Class interval
If however the classes are of unequal width, then the height of
the rectangles will be proportional to the ratio of the frequencies
to the width of the classes.
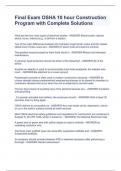
(iii) Pie Diagrams Pie diagrams are used to represent a relative
frequency distribution. A pie diagram consists of a circle divided
into as many sectors as there are classes in a frequency
distribution. The area of each sector is proportional to the
relative frequency of the class.
Now, we make angles at the centre proportional to the relative
frequencies. And in order to get the angles of the desired sectors,
we divide 360° in the proportion of the various relative
frequencies, i.e.
Frequency
Central angle = × 360°
Total frequency
Cars
120° Bus
60°
105° 75° rs
te
Bikes oo
Sc
The above pie diagram represent an illustration of types of
vehicles and their share in the total number of vehicles of a city.
(iv) Frequency Polygon To draw the frequency polygon of an
ungrouped frequency distribution, we plot the points with
abscissae as the variate values and the ordinate as the
Statistics is the Science of collection, organisation, presentation,
analysis and interpretation of the numerical data.
Useful Terms
1. Primary and Secondary Data The data collected by the
investigator himself is known as the primary data, while the
data which are not originally collected but rather obtained from
some sources is known as secondary data.
2. Variable or Variate A characteristics that varies in
magnitude from observation to observation. e.g. weight, height,
income, age, etc are variables.
3. Grouped and Ungrouped Data The data which is organised
into several groups is called grouped data where as ungrouped
data is present in original form, i.e. it is just a list of numbers.
4. Class-Intervals The groups which used to condense the data
are called classes or class-intervals.
5. Limit of the Class The starting and ending values of each
class are called Lower and Upper limits, respectively.
6. Class Size or Class Width The difference between upper and
lower boundary of a class is called size of the class.
7. Class Marks The class marks of a class is given by
Lower limit + Upper limit
.
2
8. Frequency The number of times an observation occurs in the
given data, is called the frequency of the observation.
9. Frequency Distribution It is a tabular summary of data
showing the frequency of observations.
10. Discrete Frequency Distribution A frequency distribution
is called a discrete frequency distribution, if data are presented
in such a way that exact value of the data are clearly shown.
, 11. Continuous Frequency Distribution A frequency
distribution in which data are arranged in classes (or groups)
which are not exactly measurable.
12. Cumulative Frequency Distribution In this type of
distribution, the frequencies of each class intervals are added
successively from top to bottom or from bottom to top.
A cumulative frequency distribution is of two types
(i) Less than cummulative frequency distribution In
this frequencies are added successively from top to bottom
and we represent the cumulative number of observation less
than or equal to the class frequency to which it relates.
(ii) More than cummulative frequency distribution In
this frequencies are added successively from bottom to top
and we represent the cummulative number of observation
greater than or equal to the class frequency to which it
relates.
Graphical Representation of
Frequency Distributions
(i) Bar Diagrams In bar diagrams, only the length of the bars
are taken into consideration. To draw a bar diagram, we first
mark equal lengths for the different classes on the horizontal
axis, i.e. on X-axis.
On each of these lengths on the horizontal axis, we erect
(vertical) a rectangle whose heights are proportional to the
frequency of the class.
Y
40
30
Frequency
Bikes
Cars
20
Scooters
Bus
10
0 X
Registered vehicles
(ii) Histogram To draw the histogram of a given continuous
frequency distribution, we first mark off all the class intervals
along X-axis on a suitable scale. On each of these class intervals
, on the horizontal axis, we erect (vertical) a rectangle whose
height is proportional to the frequency of that particular class,
so that the area of the rectangle is proportional to the frequency
of the class.
Y
50
40
30
Frequency
20
10
0 X
10 20 30 40 50 60
Class interval
If however the classes are of unequal width, then the height of
the rectangles will be proportional to the ratio of the frequencies
to the width of the classes.
(iii) Pie Diagrams Pie diagrams are used to represent a relative
frequency distribution. A pie diagram consists of a circle divided
into as many sectors as there are classes in a frequency
distribution. The area of each sector is proportional to the
relative frequency of the class.
Now, we make angles at the centre proportional to the relative
frequencies. And in order to get the angles of the desired sectors,
we divide 360° in the proportion of the various relative
frequencies, i.e.
Frequency
Central angle = × 360°
Total frequency
Cars
120° Bus
60°
105° 75° rs
te
Bikes oo
Sc
The above pie diagram represent an illustration of types of
vehicles and their share in the total number of vehicles of a city.
(iv) Frequency Polygon To draw the frequency polygon of an
ungrouped frequency distribution, we plot the points with
abscissae as the variate values and the ordinate as the