MVDA. Athena Summary
Week 1: Multiple Regression Analysis (MRA)
- Two sets of variables, Y and X, where there is only one Y variable and multiple X
variables (simple regression = only 1 X variable)
- All variables are interval
- When 2 or more predictors are highly correlated
Simple Regression Analysis
Y = b0 + b1X + e
- b0 = intercept
- b1 = regression weight
- X = score of a person (independent variable)
- Y = dependent variable
- e = error
Parameters need to be estimated from data, we choose b0 and b1 in a way that sum of
squares error is as small as possible (least squares estimation)
Standard Regression Formula:
- ez = error term but in standard deviation units
Regression towards the mean: Predicted value of Y is always closer to the mean than the
value of X
Multiple Regression Analysis
Goal: predict one Y variable (dependent) with multiple X variables (independent)
predict score of Y variable based on X variables
---> Asymmetric question: we go from X to Y, not other way around
---> we assume a kind of causality (X causes Y), but can’t test this with regression (remains
a correlational test)
---> WE CANNOT TEST WHETHER X IS THE CAUSE
Multiple Regression Equation:
, - Y = dependent variable predicted by X variables
- Ŷ = predicted Y
- b0 = constant / intercept. Outcome of Y when all X variables are 0
- bk = regression weights per variable (coefficient)
- e = error term
Multiple Correlation
Used to define pearson correlation between the predicted and observed values of Y:
R = ryŷ
Multiple regression gives optimal prediction of Y, which can sometimes be our ultimate goal.
Explained variance: We can use regression to see how well our X variable actually predicts
Y variable and how well each individual X variable does so.
Multiple correlation, R, indicates the correlation between the predicted values of Y and the
actual values of Y.
R is always between 0 and 1.
If we square this correlation, we have proportion of shared variance between Ŷ and Y =
proportion of explained variance (VAF).
---> VAF = how much variance is accounted for
The higher the R², the better our prediction is as a whole.
R² is the value of the sample, but we can also calculate adjusted R², which we then apply to
the population.
- N = number of people (sample size)
- k = number of predictors
SPSS: R2 and Adjusted R2 in Model Summary
,R² change = shows if change in R² (explained variance) from first model to second model is
significant
Regression Weights
Regression weights indicate how much the predicted value of Y changes when the X
variable increases with 1 unit. Our predicted value is never entirely correct, so there is
always error.
Residual = Difference between predicted value of Y and the actual value of Y
Regression line is chosen in such a way that these residuals are as small as possible so that
we can make the most accurate prediction of the population based on the sample
= AS SMALL AS POSSIBLE
Least squares method = Making differences as small as possible. Draw regression line in
such a way that if you add up all individual differences (vertical lines) you get smallest
number as possible
Standardised regression weights = indicated by β (Beta in SPSS).
Value of the weight indicates how many standard deviations Y changes when X increases by
1 standard deviation. The constant disappears when standardising.
Advantage of β’s instead of normal b’s: we can compare them directly with each other. A
higher value compared to another predictor also means more influence than that predictor.
Unstandardised b’s can’t be compared to each other because they depend on the unit with
which X is measured
Disadvantage of β’s instead of b’s: they depend on the standard deviation of our sample.
If we would then use the same formula for a different sample, it could be problematic if this
sample has a different standard deviation.
Regression equation = fill in names for variables at Y and X, look at unstandardised
coefficients B column and use the number at the constant for b0, write down values under
Unstandardised coefficients B for each bw. Also possible to write down the standardised
regression equation by using values in standardized coefficients beta column.
, - Zero-order = pearson r correlation between predictor and dependent variable or
regression coefficient between dependent variable
(Squared) Semi-Partial correlation
Semi-partial correlation = how much does a predictor uniquely add to dependent variable
(squared)
Evaluate individual predictors
Correlation between X and Y with the overlapping correlation removed.
If we square those values, we get the uniquely explained variance of the predictor = how
much variance is explained uniquely by that predictor and not by any other predictor.
---> the higher the value, the more influential the predictor is when predicting Y
---> value between 1 and -1
SPSS: part correlation
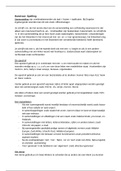
Using Venn diagram, formula for uniquely explained variance of X1 (squared semipartial
correlation):
Week 1: Multiple Regression Analysis (MRA)
- Two sets of variables, Y and X, where there is only one Y variable and multiple X
variables (simple regression = only 1 X variable)
- All variables are interval
- When 2 or more predictors are highly correlated
Simple Regression Analysis
Y = b0 + b1X + e
- b0 = intercept
- b1 = regression weight
- X = score of a person (independent variable)
- Y = dependent variable
- e = error
Parameters need to be estimated from data, we choose b0 and b1 in a way that sum of
squares error is as small as possible (least squares estimation)
Standard Regression Formula:
- ez = error term but in standard deviation units
Regression towards the mean: Predicted value of Y is always closer to the mean than the
value of X
Multiple Regression Analysis
Goal: predict one Y variable (dependent) with multiple X variables (independent)
predict score of Y variable based on X variables
---> Asymmetric question: we go from X to Y, not other way around
---> we assume a kind of causality (X causes Y), but can’t test this with regression (remains
a correlational test)
---> WE CANNOT TEST WHETHER X IS THE CAUSE
Multiple Regression Equation:
, - Y = dependent variable predicted by X variables
- Ŷ = predicted Y
- b0 = constant / intercept. Outcome of Y when all X variables are 0
- bk = regression weights per variable (coefficient)
- e = error term
Multiple Correlation
Used to define pearson correlation between the predicted and observed values of Y:
R = ryŷ
Multiple regression gives optimal prediction of Y, which can sometimes be our ultimate goal.
Explained variance: We can use regression to see how well our X variable actually predicts
Y variable and how well each individual X variable does so.
Multiple correlation, R, indicates the correlation between the predicted values of Y and the
actual values of Y.
R is always between 0 and 1.
If we square this correlation, we have proportion of shared variance between Ŷ and Y =
proportion of explained variance (VAF).
---> VAF = how much variance is accounted for
The higher the R², the better our prediction is as a whole.
R² is the value of the sample, but we can also calculate adjusted R², which we then apply to
the population.
- N = number of people (sample size)
- k = number of predictors
SPSS: R2 and Adjusted R2 in Model Summary
,R² change = shows if change in R² (explained variance) from first model to second model is
significant
Regression Weights
Regression weights indicate how much the predicted value of Y changes when the X
variable increases with 1 unit. Our predicted value is never entirely correct, so there is
always error.
Residual = Difference between predicted value of Y and the actual value of Y
Regression line is chosen in such a way that these residuals are as small as possible so that
we can make the most accurate prediction of the population based on the sample
= AS SMALL AS POSSIBLE
Least squares method = Making differences as small as possible. Draw regression line in
such a way that if you add up all individual differences (vertical lines) you get smallest
number as possible
Standardised regression weights = indicated by β (Beta in SPSS).
Value of the weight indicates how many standard deviations Y changes when X increases by
1 standard deviation. The constant disappears when standardising.
Advantage of β’s instead of normal b’s: we can compare them directly with each other. A
higher value compared to another predictor also means more influence than that predictor.
Unstandardised b’s can’t be compared to each other because they depend on the unit with
which X is measured
Disadvantage of β’s instead of b’s: they depend on the standard deviation of our sample.
If we would then use the same formula for a different sample, it could be problematic if this
sample has a different standard deviation.
Regression equation = fill in names for variables at Y and X, look at unstandardised
coefficients B column and use the number at the constant for b0, write down values under
Unstandardised coefficients B for each bw. Also possible to write down the standardised
regression equation by using values in standardized coefficients beta column.
, - Zero-order = pearson r correlation between predictor and dependent variable or
regression coefficient between dependent variable
(Squared) Semi-Partial correlation
Semi-partial correlation = how much does a predictor uniquely add to dependent variable
(squared)
Evaluate individual predictors
Correlation between X and Y with the overlapping correlation removed.
If we square those values, we get the uniquely explained variance of the predictor = how
much variance is explained uniquely by that predictor and not by any other predictor.
---> the higher the value, the more influential the predictor is when predicting Y
---> value between 1 and -1
SPSS: part correlation
Using Venn diagram, formula for uniquely explained variance of X1 (squared semipartial
correlation):