100% satisfaction guarantee Immediately available after payment Both online and in PDF No strings attached
logo-home
Research methods complete summary $8.39   Add to cart

Class notes

Research methods complete summary

1 review
 82 views  3 purchases
  • Course
  • Institution
  • Book

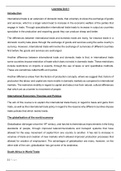
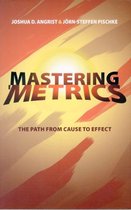
In this document, you can find a complete summary for the course Research Methods: Applied Empirical Economics. This includes lecture notes and the book 'Mastering metrics' is discussed.

Preview 2 out of 11  pages

  • August 3, 2021
  • 11
  • 2020/2021
  • Class notes
  • Prof.dr. p.w.c. koning & dr. e.l.w. jongen
  • All classes

1  review

review-writer-avatar

By: jasperloth • 1 month ago

avatar-seller
Research Methods summary mid-term
Randomized controlled trials
What you need to know:
• Understand selection bias
• Understand how randomization eliminates selection bias
• Become familiar with notation
• Become familiar with helpful statistics


Notation
Suppose there are two potential outcomes Y for individual i:
• Y1i health status with insurance
• Y0i health status without insurance
• Causal effect of insurance Y1i – Y0i
Fundamental problem: only one of the two paths is observed


What do we measure?
Difference in group means = Avgn[Y1i|Di=1] – Avgn’[Yoi|Di=o]
AVG = average over individuals n
Y = outcome
Di = dummy for individuals 1=yes 0=no
Suppose that treatment has the same effect κ for everybody:
Y1i – Y0i = κ


Selection bias:
Difference in group means
= Avgn[Y1i|Di=1] – Avgn’[Yoi|Di=o]
= Avgn[Y0i|Di=1] + κ – Avgn’[Yoi|Di=o]
= κ + Avgn[Y0i|Di=1] – Avgn’[Yoi|Di=o]
= average causal effect + selection bias
Average causal effect (κ) + selection bias (AVGn [Y0i|Di=1] – AVGn’(Y0i|Di=0])
The difference in group means captures the causal effect if: AVGn [Y0i|Di=1] =
AVGn’(Y0i|Di=0], because both groups are the same

, When we think about averages and we have a large group, we use ‘E’ (population) instead of
AVG, so: E [Y1i|Di=1] – E (Y0i|Di=0]
Some useful statistics
- Estimated treatment coefficient: effect of the treatment.
- Estimated standard error
- T-value ETC/ESE
o Big enough, smaller than -2 or bigger than +2 → we can reject the 0-hypotheses
(because of the 95% confidence interval)
- P-value that the coefficient equals 0,

The benefits of buying summaries with Stuvia:

Guaranteed quality through customer reviews

Guaranteed quality through customer reviews

Stuvia customers have reviewed more than 700,000 summaries. This how you know that you are buying the best documents.

Quick and easy check-out

Quick and easy check-out

You can quickly pay through credit card or Stuvia-credit for the summaries. There is no membership needed.

Focus on what matters

Focus on what matters

Your fellow students write the study notes themselves, which is why the documents are always reliable and up-to-date. This ensures you quickly get to the core!

Frequently asked questions

What do I get when I buy this document?

You get a PDF, available immediately after your purchase. The purchased document is accessible anytime, anywhere and indefinitely through your profile.

Satisfaction guarantee: how does it work?

Our satisfaction guarantee ensures that you always find a study document that suits you well. You fill out a form, and our customer service team takes care of the rest.

Who am I buying these notes from?

Stuvia is a marketplace, so you are not buying this document from us, but from seller wesselnagelgast89. Stuvia facilitates payment to the seller.

Will I be stuck with a subscription?

No, you only buy these notes for $8.39. You're not tied to anything after your purchase.

Can Stuvia be trusted?

4.6 stars on Google & Trustpilot (+1000 reviews)

83662 documents were sold in the last 30 days

Founded in 2010, the go-to place to buy study notes for 14 years now

Start selling
$8.39  3x  sold
  • (1)
  Add to cart