100% satisfaction guarantee Immediately available after payment Both online and in PDF No strings attached
logo-home
Summary ERSS6824 - Statistics $10.96   Add to cart

Summary

Summary ERSS6824 - Statistics

 22 views  0 purchase
  • Course
  • Institution

Very Helpful document to master your ERSS6824 Statistics Module for Honours level. This is a powerful tool to have in order to pass this module successfully.

Preview 2 out of 58  pages

  • August 25, 2021
  • 58
  • 2021/2022
  • Summary
avatar-seller
ERSS 6824
SUMMARIES


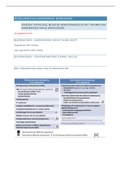
REMEMBER:
 In “data view”:
o Each column = variable
o Each row = respondent
 Distinguish between data levels, because different descriptive statistics are used:
CATEGORICAL CONTINUOUS
Nominal Interval
 Age can be categorical or nominal
Ordinal Ratio
How to know: in variable view, it will show How to know: in variable view, it will not
values show any values
Frequencies Descriptives
No reliability analysis Reliability analysis
Biographical data is mostly categorical Scales, ex. Likert scales

QUESTIONS THAT SHOULD BE ASKED WHEN ANALYSING ANY DATASET:
1. How do I determine the frequencies of my biographical data?
o Code the data according to biographical information
o Use descriptive statistics (mean, mode, skewness, standard deviation, etc.)
2. How do I determine the psychometric properties of my questionnaire?
o Conduct reliability analysis (Cronbach’s alpha)
o Conduct factor analysis
3. How do I determine if there is a relationship between certain variables?
o Use correlation analysis (Pearson’s Product Moment Correlation / Chi-Square test
of independence)
4. How do I determine which variables (independent variables) are significant predictors
of an outcome (criterion)?
o Multiple regression
5. How do I determine if there are any significant differences between two groups?
o If the sample is small and skewed, use Mann-Whitney U test
o If the sample size is relatively big, use t-test
6. How do I determine if there are any significant differences between amongst 3 or
more groups?
o If the samples is small and skewed, use Kruskal-Wallis test
o If the sample is relatively big, use ANOVA

, HOW TO OPEN:
 File – open – data – look for drive – open/double click

SAVE
 Only ONE data file
 Only ONE output file

HOW TO KNOW THE MEANINGS OF VALUES UNDER EACH VARIABLE:
 In variable view: values –

The benefits of buying summaries with Stuvia:

Guaranteed quality through customer reviews

Guaranteed quality through customer reviews

Stuvia customers have reviewed more than 700,000 summaries. This how you know that you are buying the best documents.

Quick and easy check-out

Quick and easy check-out

You can quickly pay through credit card or Stuvia-credit for the summaries. There is no membership needed.

Focus on what matters

Focus on what matters

Your fellow students write the study notes themselves, which is why the documents are always reliable and up-to-date. This ensures you quickly get to the core!

Frequently asked questions

What do I get when I buy this document?

You get a PDF, available immediately after your purchase. The purchased document is accessible anytime, anywhere and indefinitely through your profile.

Satisfaction guarantee: how does it work?

Our satisfaction guarantee ensures that you always find a study document that suits you well. You fill out a form, and our customer service team takes care of the rest.

Who am I buying these notes from?

Stuvia is a marketplace, so you are not buying this document from us, but from seller jodey0711. Stuvia facilitates payment to the seller.

Will I be stuck with a subscription?

No, you only buy these notes for $10.96. You're not tied to anything after your purchase.

Can Stuvia be trusted?

4.6 stars on Google & Trustpilot (+1000 reviews)

67866 documents were sold in the last 30 days

Founded in 2010, the go-to place to buy study notes for 14 years now

Start selling
$10.96
  • (0)
  Add to cart