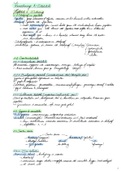
Samenvatting en oplossingen oefeningen Kansrekening En Statistiek (1017594BNR)
2 purchases
Course
Kansrekening En Statistiek (1017594BNR)
Institution
Vrije Universiteit Brussel (VUB)
1.Beschrijvende statistiek.
2.Elementaire kansrekening: het begrip 'kans', het rekenen van kansen, stochastische veranderlijken (stochastieken) en hun kansverdeling, verwachtingswaarde, variantie en hogere momenten, covariantie en correlatie.
3.Overzicht van veelgebruikte kansverdelingen, zoals d...
steunt
op
resultaten uit
beschrijvende stat µ laanstheoui om
uitspraken tedoen over
ganse
populatie
Generaliseren a-verzamelde info naar
grotergeheel
1. 3 .
Gegevens de variabelen
Ruwe
gegevens waarnemingen uitgevoerd op : individuen
Variabele ) kenmerk dat is itstat onderzoek
(
veranderlijke :
onderwerp verschillende
.
→ kan verschillende waarden aannemen o_O individuen in
steekproef
→
hoofdletters ×
.
Y, Z .
1. 4. Soorten data
-
Soorten data -
kwalitatiefhaarkleur
categorisch ( )
Â
kwantitatief getallen
(
hladijpe dis →
→
.
ctn
Geen getallen buiteling !
afrondingen .
1. 4 .
1 .
De schalen
nominale schaal
→
kwalitatief
:
beschrijving in woorden
→ individuen
mogen
slechts n
mogelijke waarde vat variabele krijgen (niet overlappend
→ vb :
zwart ,
wit
1
,Oudimale schaal :
gerangschikte waarden
→
geenprecieze afstand tussen categorieën
vb slecht
goed goed gemiddeld
→ : zeer ,
, ,
Empirische
Het cumulatieffrequentiehistogram benadert de grafiek
verdelingsfunctie
verdelingsfunctie
van de
empirische
gedefinieerd metingen
En ,
als :
En
aantal ⇐ ×
met n =
tot#
metingen (× ) =
en
3
, De
functie En 1×1 is een
trapfunctie die in de
datapunten
✗i een
sprong
maakt .
Hoogte sprong is veelvoud in
vb dataset :
na
2,2 , 4,
^
, 5
n
•
np
-
-0
•
0,8
-
•- 0
0 6 -
,
-
on
O
, { 050
÷ :
'
:
'
s s
d-blond
Stengel diagram
2. 1.6 .
-
blad
Elk
waarnemingsgetal opsplitsen
Vorm tabel doet denken
in 2 delen : stam &
aan
hijgend histogram
deoiguam de taartdiagram (kwalitatief klassen
& 1-7Pareto
.
)
Pareto
diagram
vhd
histogram waarin verschillende
corresponderen
=
variabele
met
mogelijke
waarden
→ klassen ío
gerangschikt zodat klasse met
hoogste fveq L d
laagste R
Taart
diagram
:
app correspondeert
met
fuq
8.
Suatberdiaguam
& 1 .
.
metingen
voorstellen in
die variabelen er 2
afhangen ofxp met ^
afh dr onafh variabele
data
seatterdiagvasn
→
geeft relatie tussen 2 weer
4
The benefits of buying summaries with Stuvia:
Guaranteed quality through customer reviews
Stuvia customers have reviewed more than 700,000 summaries. This how you know that you are buying the best documents.
Quick and easy check-out
You can quickly pay through credit card or Stuvia-credit for the summaries. There is no membership needed.
Focus on what matters
Your fellow students write the study notes themselves, which is why the documents are always reliable and up-to-date. This ensures you quickly get to the core!
Frequently asked questions
What do I get when I buy this document?
You get a PDF, available immediately after your purchase. The purchased document is accessible anytime, anywhere and indefinitely through your profile.
Satisfaction guarantee: how does it work?
Our satisfaction guarantee ensures that you always find a study document that suits you well. You fill out a form, and our customer service team takes care of the rest.
Who am I buying these notes from?
Stuvia is a marketplace, so you are not buying this document from us, but from seller jorunnfrancken. Stuvia facilitates payment to the seller.
Will I be stuck with a subscription?
No, you only buy these notes for $8.06. You're not tied to anything after your purchase.