DATA
dataANALYSIS
analysis
Famke Nouwens
Lecture 1 + 2 – Exploratory Data Analysis & Effective Visualizations
The process of how data analysis should be done is as follows (where we ask a question first and find
the data later):
1. Ask an interesting question
− What is the scientific goal?
− What would you do if you had all the data?
− What do you want to predict or estimate?
2. Get the data
− How were the data sampled?
− Which data are relevant?
− Are there privacy issues?
3. Explore the data
− Plot the data
− Are there patterns/anomalies?
4. Model the data
− Build, fit and validate the model
5. Communicate and visualize the results
− What did we learn?
− Do the results make sense?
To start asking interesting questions there are the 5 W-questions: Who, What, When, Where and Why
(and hoW).
Major tasks in data exploration:
0. Data Auditing
1. Data inspection/preparation
2. Data cleaning
3. Data transformation
4. Data reduction
5. Data integration
0. Data auditing
How do I find my data & where does it come from:
− Internal sources: data is already collected by the organization
− Existing external sources: data is available in ready-to-read format (can be free or paid)
− External sources requiring collection efforts: data is available from external source but
acquiring it requires special processing
There are different types of values (numeric, Boolean, text, date & time, dictionaries etc.) and they can
be stored in different ways as well:
− Tabular data: dataset that is a 2D-table where each row represents a record and each column
represents an attribute/type of measurement (e.g. csv, tsp, xlsx)
− Structured data: each data record is presented in a form of a possibly complex and multi-tiered
dictionary (e.g. JSON, xml)
− Semi/Un-structured data: chaos!
, To deal with messy data you need to reorganize the information to make the event observed and its
associated variables explicit. An example is the following table, where the issue is that we cannot see
the variable we’re trying to measure (number of deliveries).
Friday Saturday Sunday
Morning 15 158 10
Afternoon 2 90 20
Evening 55 12 45
Some problems can be: column headers are values, not variables, or variables are stored in both rows
and columns, or multiple variables are stored in one column etc.
In general, we desire a tabular dataset (each row a record and each column a single variable).
1. Data inspection/preparation
This is the phase where you take the necessary first steps to assess the quality and value of the data.
To visualize the data, there are many different possibilities. For categorical variables (= variables that
take a value in a limited set) you can use:
− Frequency tables
− Relative frequency tables (%)
− Bar charts
− Pie charts
When determining which attribute-value is better, you need to look at the conditional distribution. This
is a distribution that shows the percent of one variable satisfying the conditions of another (Titanic
example).
Things that can go wrong when looking at visualisations:
0. Confusing percentages of the whole with marginal percentages
1. Leaving out marginal percentages
2. Making conclusions based on only a few individuals
3. Making independent conclusions when there is only a small difference
4. Fitting a line in a graph instead of a bar chart when you have categorical data (does not make
sense → there cannot be a value in between).
For quantitative variables (= variables that take numerical values) you can use histograms (and stack
them or combine them). A histogram is a chart that displays quantitative data using so-called bins,
where different bin-widths tell different stories: you can use various bin sizes to view the data with a
different scope. You can also plot multiple histograms to visualise how different variables compare (or
how a variable differs over specific groups).
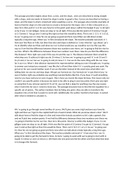
A histogram can have multiple distributions:
Uniform (almost flat) Skewed right Skewed left
If the histogram looks the same on the right and left of its centre, it has a symmetric distribution.
Summary of statistics:
dataANALYSIS
analysis
Famke Nouwens
Lecture 1 + 2 – Exploratory Data Analysis & Effective Visualizations
The process of how data analysis should be done is as follows (where we ask a question first and find
the data later):
1. Ask an interesting question
− What is the scientific goal?
− What would you do if you had all the data?
− What do you want to predict or estimate?
2. Get the data
− How were the data sampled?
− Which data are relevant?
− Are there privacy issues?
3. Explore the data
− Plot the data
− Are there patterns/anomalies?
4. Model the data
− Build, fit and validate the model
5. Communicate and visualize the results
− What did we learn?
− Do the results make sense?
To start asking interesting questions there are the 5 W-questions: Who, What, When, Where and Why
(and hoW).
Major tasks in data exploration:
0. Data Auditing
1. Data inspection/preparation
2. Data cleaning
3. Data transformation
4. Data reduction
5. Data integration
0. Data auditing
How do I find my data & where does it come from:
− Internal sources: data is already collected by the organization
− Existing external sources: data is available in ready-to-read format (can be free or paid)
− External sources requiring collection efforts: data is available from external source but
acquiring it requires special processing
There are different types of values (numeric, Boolean, text, date & time, dictionaries etc.) and they can
be stored in different ways as well:
− Tabular data: dataset that is a 2D-table where each row represents a record and each column
represents an attribute/type of measurement (e.g. csv, tsp, xlsx)
− Structured data: each data record is presented in a form of a possibly complex and multi-tiered
dictionary (e.g. JSON, xml)
− Semi/Un-structured data: chaos!
, To deal with messy data you need to reorganize the information to make the event observed and its
associated variables explicit. An example is the following table, where the issue is that we cannot see
the variable we’re trying to measure (number of deliveries).
Friday Saturday Sunday
Morning 15 158 10
Afternoon 2 90 20
Evening 55 12 45
Some problems can be: column headers are values, not variables, or variables are stored in both rows
and columns, or multiple variables are stored in one column etc.
In general, we desire a tabular dataset (each row a record and each column a single variable).
1. Data inspection/preparation
This is the phase where you take the necessary first steps to assess the quality and value of the data.
To visualize the data, there are many different possibilities. For categorical variables (= variables that
take a value in a limited set) you can use:
− Frequency tables
− Relative frequency tables (%)
− Bar charts
− Pie charts
When determining which attribute-value is better, you need to look at the conditional distribution. This
is a distribution that shows the percent of one variable satisfying the conditions of another (Titanic
example).
Things that can go wrong when looking at visualisations:
0. Confusing percentages of the whole with marginal percentages
1. Leaving out marginal percentages
2. Making conclusions based on only a few individuals
3. Making independent conclusions when there is only a small difference
4. Fitting a line in a graph instead of a bar chart when you have categorical data (does not make
sense → there cannot be a value in between).
For quantitative variables (= variables that take numerical values) you can use histograms (and stack
them or combine them). A histogram is a chart that displays quantitative data using so-called bins,
where different bin-widths tell different stories: you can use various bin sizes to view the data with a
different scope. You can also plot multiple histograms to visualise how different variables compare (or
how a variable differs over specific groups).
A histogram can have multiple distributions:
Uniform (almost flat) Skewed right Skewed left
If the histogram looks the same on the right and left of its centre, it has a symmetric distribution.
Summary of statistics: