IOP2601 Assignment 4 (COMPLETE ANSWERS) Semester 2 2024 - DUE 22 October 2024
IOP2601 Assignment 4 (COMPLETE ANSWERS) Semester 2 2024 - DUE 22 October 2024; 100% TRUSTED Complete, trusted solutions and explanations.
All for this textbook (78)
Written for
University of Cape Town (UCT)
Organisational Psychology (BUS3004S)
All documents for this subject (5)
Seller
Follow
sarahismail
Content preview
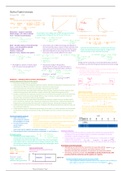
WEEK 11
Hypothesis Testing
Basic principles of null-hypothesis significance testing
Null Hypothesis:
1.) Formulate H1 (alternative hypothesis) and H0 (null hypothesis) about the population of
interest
• H0: Null hypothesis: This is the default – a conclusion of no effect or relationship
• H1: Alternative hypothesis: describes your prediction or the effect you are
anticipating
Formulating Hypotheses
• Hypothesis: a specific statement of prediction
Can be stated in the form of:
a relationship
or difference
Each type of hypothesis will require a type of statistical test
a relationship hypothesis will use some type of correlation test
Is the apparent relationship really there?
a difference hypothesis will use, for example, a t-test or analysis of variance
(ANOVA)
Is the apparent difference really there?
Directional and Non-directional hypotheses
• A directional hypothesis
Specifies the direction of the difference or relationship.
• Non-directional hypothesis
States that one group differs from another on an outcome/dependent variable or
related variables in a specific way.
It does not specify or predict the direction of the difference or the relationship.
,Examples:
• There is a positive relationship between well-being and work engagement
(directional hypothesis)
• There is a significant relationship between well-being and work engagement (non-
directional hypothesis)
• Postgraduate students have higher levels of stress than undergraduates (directional
hypothesis)
• Postgraduates differ in levels of stress to undergraduates (non-directional)
• Is the observed relationship/difference due to chance, or is it a real one? (i.e., is the
apparent variable relationship or observed mean difference statistically significant)
• Is there a real effect due to the treatment (i.e., manipulation of the IV), or is it a
chance variation? (i.e., is it a statistically significant effect)
• To understand the concept of statistical significance, it is helpful to recall the
relationship between the normal distribution and probability levels
2.) Set a cut-off probability point (usually 0.05 or less)
• When we test hypotheses using statistics, we have to work in these terms.
• We cannot talk about the null hypothesis has been true or the alternate hypothesis
has been true….
We can only talk about the probability of obtaining a set of data if, hypothetically, the null
hypothesis (of no effect) was true
• Set a cut-off point where you can say it is improbable that a given observation or
score is simply one of the chance occurrences around the mean of the normal
distribution
• Conventionally accepted probability levels/cut off points for decisions about
statistical significance are 0.05 or 0.01.
• We set a cut-off point when we can say it is improbable that a given observation or
score is simply one of the chance occurrences around the mean of the normal
distribution. And as I have said, usually, we use .05 or .01 to help us make decisions
about statistical significance.
3.) Collect your sample data:
Once we have set a cut-off probability point, then we collect our sample data.
4.) Employ the correct statistical test to calculate an appropriate test statistic (using a
statistical software package like SPSS):
- We collect the data.
- We put it into a spreadsheet.
, - We manually calculate a test statistic or use statistical software to calculate the
correct test statistic given the research questions and hypothesis you have.
A test statistic:
• is a statistic for which we know how frequently different values occur,
• the probability of the value occurring or the probability of distribution function. A Z-
score is a test statistic- because we know the probability of a specific Z-value
occurring.
• Z-score is a type of test statistic. But there are many test statistics for which we know
the probability of a specific test statistic occurring. We already know the z-statistic.
• There is also T-statistics, F-statistic and Chi-squared statistic.
• A Z-statistic is a good one to start with. It is a common probability distribution that
we use for significance testing.
5.) Look up the probability of getting that test statistic if the null hypothesis (no effect) was
true
When we calculate the test statistic, we can use different software packages.
The fifth step is looking up the probability of getting that test statistic if the null hypothesis
(of no effect) was true.
• If we have designed a stress-management intervention and tested our participants
before the intervention and then four weeks after the intervention, we would then
calculate a test statistic to detect the change in stress levels before and after the
intervention.
• Then, we would look up the probability of getting that test statistic if our
intervention had no effect.
• What is the probability of getting a reduction in stress levels post-intervention if our
programme/training had no effect at all?
• Suppose that probability is lower than your cut-off point (usually .05). In that case,
we reject the null hypothesis and gain confidence in the alternate hypothesis.
But, when we set up a cut-off point of .05, we essentially accept a 5% chance that we will
wrongly reject our null hypothesis.
• This means that there is a 5% chance that the effect could be viewed by chance
alone.
• There is a 5% chance that the stress level scores would vary before and after the
intervention (example).
• There is a 5% chance that the changes we see happen by chance alone- and not
caused by intervention at all.
To be more confident in our observations, we can set up a cut-off point of .01, which means
that we accept only a 1% chance of seeing the variation in our scores (i.e., stress level
scores).
, Bearing in mind that there is still a 1% chance that we will reject our null hypothesis
wrongly. But at least it is a small chance or low probability, so I would be more convinced.
But, important to note that we usually use this .05 cut-off point. So, as researchers, we often
accept the 5% chance of wrongly rejecting our null hypothesis. We will say our intervention
had an impact, whilst in actual fact, our intervention did not cause any change or had no
impact.
This is why it is important to set your probability and then look up the probability of getting
that test statistic from the inferential statistics you have performed if the null hypothesis is
true. This idea of accepting a certain chance that we will wrongly reject our null hypothesis
brings us to the idea of a Type I error.
6.) Suppose that probability is lower than your cut-off point (usually 0.05). In that case, we
reject the null hypothesis and gain confidence in the alternate hypothesis.
Step 6 is checking if your probability is lower than your cut-off point. If it is lower, we
reject the null hypothesis and gain confidence in the alternate hypothesis.
Type I and Type II error
Type 1 error:
Rejecting the null hypothesis even though it was true
• In other words – saying “there is an effect” where there is none
• Often won’t accept more than a 10% probability of this (α = 0.1)
(α=alpha)
• Type II error: accepting the null hypothesis (no effect, no difference) even though it
was wrong
(β = beta)
• Saying “there is not an effect” where there actually is
• Often allow for 20% probability of this (β = 0.2)
• The power of a statistical test (ability to detect an effect that is there) = 1- β i.e., 1-
0.2 = 0.8 - or 80% power.
Type II error:
• This is when we accept the null hypothesis of no effect, even though it was wrong.
• We would say our intervention had no effect when it actually did have an impact.
• We often allow for a 20% probability of this. This is related to statistical power.
When we talk about statistical power in statistical tests, we are talking about the
ability of your inferential statistics to detect an effect between groups, or the
relationship between variables or the effect of an intervention.
• We go 1 minus the probability of type two error, and we can get our percentage or
power.
The benefits of buying summaries with Stuvia:
Guaranteed quality through customer reviews
Stuvia customers have reviewed more than 700,000 summaries. This how you know that you are buying the best documents.
Quick and easy check-out
You can quickly pay through credit card or Stuvia-credit for the summaries. There is no membership needed.
Focus on what matters
Your fellow students write the study notes themselves, which is why the documents are always reliable and up-to-date. This ensures you quickly get to the core!
Frequently asked questions
What do I get when I buy this document?
You get a PDF, available immediately after your purchase. The purchased document is accessible anytime, anywhere and indefinitely through your profile.
Satisfaction guarantee: how does it work?
Our satisfaction guarantee ensures that you always find a study document that suits you well. You fill out a form, and our customer service team takes care of the rest.
Who am I buying these notes from?
Stuvia is a marketplace, so you are not buying this document from us, but from seller sarahismail. Stuvia facilitates payment to the seller.
Will I be stuck with a subscription?
No, you only buy these notes for $10.93. You're not tied to anything after your purchase.