Chapter 8
Government intervention to reduce inequality and poverty
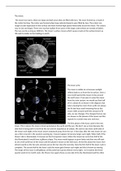
Inequality and poverty in SADC countries:
Measures to quantify inequality and poverty:
1. Poverty rates → % of the population living below the “poverty line” → US$ 3.20 per
person per day (International poverty line determined by the World bank in 2018).
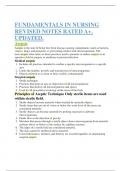
2. Gini coefficient → measure of income distribution → deviation of actual income
distribution in a country from the line of absolute equality
- 0 > GC < 1 → closer to 1 = more unequal income distribution
- 0 = perfect equality → Lorenz curve is the same as the actual distribution.
- 1 = perfect inequality → all income goes to one member of the population.
Poverty Income inequality
Country (Year) Rates Gini Income shares
(<$3.20 p.d) Coefficient Poorest 20% Richest 20%
Angola (2008) 55,7 0,427 5,4 48,5
Botswana (2009) 37,1 0,605 2,8 65,0
Congo (DRC) 2012) 91,3 0,421 5,5 48,4
Eswatini (2009) 64,4 0,515 4,0 56,7
Lesotho (2010) 78,1 0,542 2,8 58,2
Madagascar (2012) 91,1 0,426 5,7 49,4
Malawi (2010) 88,8 0,455 5,5 51,8
Mauritius (2012) 3,2 0,358 7,4 43,9
Mozambique (2014) 81,9 0,540 4,2 59,5
Namibia (2009) 47,0 0,611 3,3 66,4
Seychelles (2013) 2,5 0,468 5,4 53,0
South Africa (2014) 37,6 0,630 2,4 68,2
Tanzania (2015) 79,0 0,378 7,4 45,8
Zambia (2015) 74,3 0,571 2,9 61,3
Zimbabwe (2011) 47,2 0,432 5,8 49,7
- Table analysis:
o Poverty is spread across all SADC countries (except Seychelles and
Mauritius)
o In Mozambique → population is equally poor → moderate GC
o In SA → income spread is more significant → high GC
▪ Poverty rate (37,6%) is high for a middle-income country in
comparison to other middle-income countries (Brazil (8,0%);
Colombia (11,8%) and Indonesia 30,9%).
- Gini coefficient income shares per income quintile for SA:
o Quintile 1 (lowest) = 2,4%
o Quintile 2 = 4,8%
o Quintile 3 = 8,2%
o Quintile 4 = 16,5%
o Quintile 5 (highest) = 68,2%
o NOTE! Lowest 40% of the population only earn 7.2% of SA’s total income.
o
Notes by Georgia Taylor EKN 310 1
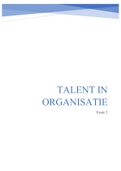
, o GC is derived from the Lorenz curve → shows cumulative income shares
of cumulative fractions of the population.
o GC is the measure of the extent to which actual income
distribution deviates from the Lorenz curve.
o Calculation method using the graph: area A/(area A + area B)
100
Cumulative share of income
100
A
B
0 100
Cumulative share of pop.
Budget redistribution and poverty alleviation:
Fiscal policy tools used to reduce poverty and inequality:
- Include taxes, government expenditure programmes and regulation.
- Short term → national budget an important instrument to influence distribution of
private earnings.
- Long term → (indirect effects of fiscal system) → government spending and taxes
influence economic growth rates, investment in physical and human capital
(major determinants of distribution of earnings from capital and labour activity)
o Government needs to effect structural changes to influence economic
output and growth → big challenge = design a system to help the poor
and empower people to lift themselves out of poverty (human capital
investment)
Distinctions in income:
- Primary income (Yp) → personal income of individual, household or group
reflecting the actual income received in cash or in kind.
o Gross income (income before tax)
o Disposable income
- Secondary income (Ys): Primary income – direct taxes paid from Yp (disposable
income) + value of government services consumed.
o Income after government intervention.
𝑌𝑠 = 𝑌𝑝 – 𝑇𝑑 + 𝐺
Td = direct taxes G = government expenditure
- Two policy approaches will be examined to change Yp and Ys through
government intervention.
Notes by Georgia Taylor EKN 310 2
Government intervention to reduce inequality and poverty
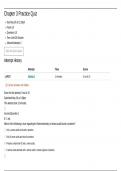
Inequality and poverty in SADC countries:
Measures to quantify inequality and poverty:
1. Poverty rates → % of the population living below the “poverty line” → US$ 3.20 per
person per day (International poverty line determined by the World bank in 2018).
2. Gini coefficient → measure of income distribution → deviation of actual income
distribution in a country from the line of absolute equality
- 0 > GC < 1 → closer to 1 = more unequal income distribution
- 0 = perfect equality → Lorenz curve is the same as the actual distribution.
- 1 = perfect inequality → all income goes to one member of the population.
Poverty Income inequality
Country (Year) Rates Gini Income shares
(<$3.20 p.d) Coefficient Poorest 20% Richest 20%
Angola (2008) 55,7 0,427 5,4 48,5
Botswana (2009) 37,1 0,605 2,8 65,0
Congo (DRC) 2012) 91,3 0,421 5,5 48,4
Eswatini (2009) 64,4 0,515 4,0 56,7
Lesotho (2010) 78,1 0,542 2,8 58,2
Madagascar (2012) 91,1 0,426 5,7 49,4
Malawi (2010) 88,8 0,455 5,5 51,8
Mauritius (2012) 3,2 0,358 7,4 43,9
Mozambique (2014) 81,9 0,540 4,2 59,5
Namibia (2009) 47,0 0,611 3,3 66,4
Seychelles (2013) 2,5 0,468 5,4 53,0
South Africa (2014) 37,6 0,630 2,4 68,2
Tanzania (2015) 79,0 0,378 7,4 45,8
Zambia (2015) 74,3 0,571 2,9 61,3
Zimbabwe (2011) 47,2 0,432 5,8 49,7
- Table analysis:
o Poverty is spread across all SADC countries (except Seychelles and
Mauritius)
o In Mozambique → population is equally poor → moderate GC
o In SA → income spread is more significant → high GC
▪ Poverty rate (37,6%) is high for a middle-income country in
comparison to other middle-income countries (Brazil (8,0%);
Colombia (11,8%) and Indonesia 30,9%).
- Gini coefficient income shares per income quintile for SA:
o Quintile 1 (lowest) = 2,4%
o Quintile 2 = 4,8%
o Quintile 3 = 8,2%
o Quintile 4 = 16,5%
o Quintile 5 (highest) = 68,2%
o NOTE! Lowest 40% of the population only earn 7.2% of SA’s total income.
o
Notes by Georgia Taylor EKN 310 1
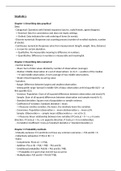
, o GC is derived from the Lorenz curve → shows cumulative income shares
of cumulative fractions of the population.
o GC is the measure of the extent to which actual income
distribution deviates from the Lorenz curve.
o Calculation method using the graph: area A/(area A + area B)
100
Cumulative share of income
100
A
B
0 100
Cumulative share of pop.
Budget redistribution and poverty alleviation:
Fiscal policy tools used to reduce poverty and inequality:
- Include taxes, government expenditure programmes and regulation.
- Short term → national budget an important instrument to influence distribution of
private earnings.
- Long term → (indirect effects of fiscal system) → government spending and taxes
influence economic growth rates, investment in physical and human capital
(major determinants of distribution of earnings from capital and labour activity)
o Government needs to effect structural changes to influence economic
output and growth → big challenge = design a system to help the poor
and empower people to lift themselves out of poverty (human capital
investment)
Distinctions in income:
- Primary income (Yp) → personal income of individual, household or group
reflecting the actual income received in cash or in kind.
o Gross income (income before tax)
o Disposable income
- Secondary income (Ys): Primary income – direct taxes paid from Yp (disposable
income) + value of government services consumed.
o Income after government intervention.
𝑌𝑠 = 𝑌𝑝 – 𝑇𝑑 + 𝐺
Td = direct taxes G = government expenditure
- Two policy approaches will be examined to change Yp and Ys through
government intervention.
Notes by Georgia Taylor EKN 310 2