100% satisfaction guarantee Immediately available after payment Both online and in PDF No strings attached
logo-home
Summary / Samenvatting (managerial Statistcis -G. Keller (2012)) - Statistic part of Business Research Methods (EBS001A10) $3.21
Add to cart

Summary

Summary / Samenvatting (managerial Statistcis -G. Keller (2012)) - Statistic part of Business Research Methods (EBS001A10)

 22 views  3 purchases
  • Course
  • Institution
  • Book

Summary / Samenvatting (managerial Statistcis -G. Keller (2012)) - Statistic part of Business Research Methods (EBS001A10) Summary of Chapter 1-13 & 15-17 & 19

Preview 5 out of 30  pages

  • No
  • Chapter 1-13 & 15-17 &19
  • December 3, 2021
  • 30
  • 2021/2022
  • Summary
avatar-seller
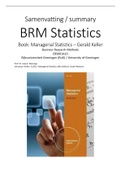
Samenvatting / summary

BRM Statistics
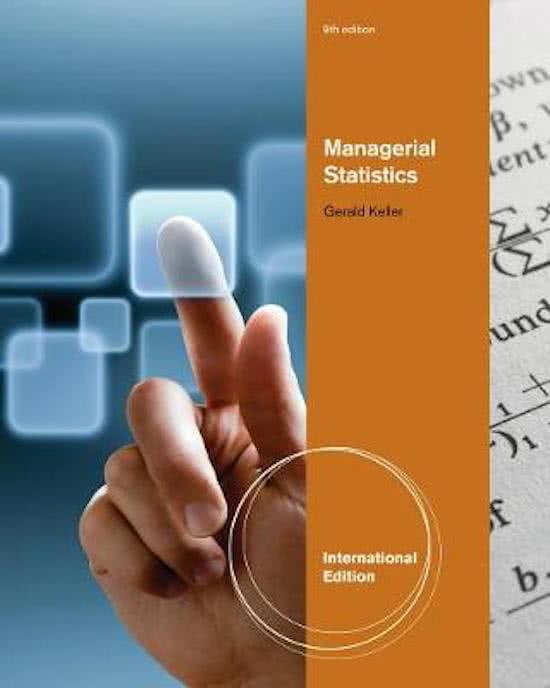
Book: Managerial Statistics – Gerald Keller
Business Research Methods
EBS001A10
Rijksuniversiteit Groningen (RuG) / University of Groningen
Prof. dr. Jaap E. Wieringa
Literature: Keller, G.2012. Managerial Statistics (9th edition). South-Western.

,Inhoud
1. What is statistics? (1) ....................................................................................................................... 4
1.1 Key Statistical Concepts................................................................................................................. 4
1.2 Statistical applications in Business ................................................................................................ 4
1.3 Large real data sets........................................................................................................................ 4
2. Graphical Descriptive Techniques I (1) ................................................................................................ 4
2.1 Types of data and information ...................................................................................................... 4
2.2 Describing a set of nominal data ................................................................................................... 5
2.3 Describing the relationship between two nominal variables and comparing two or more
nominal data sets ................................................................................................................................ 5
3. Graphical descriptive techniques II (1) ................................................................................................ 5
3.1 Graphical techniques to describe a set of interval data ................................................................ 5
3.2 Describing time-series data ........................................................................................................... 6
3.3 Describing the relationship between two interval variables ........................................................ 6
4. Numerical Descriptive techniques (1 & 5) ....................................................................................... 7
4.1 Measures of central location (1) ................................................................................................... 7
4.2 Measures of Variability (1) ............................................................................................................ 7
4.3 Measures of relative standing and Box plots (1) ........................................................................... 8
4.4 Measures of linear relationship (5) ............................................................................................... 9
6. Probability (1) ...................................................................................................................................... 9
6.1 Assigning Probability to Events ..................................................................................................... 9
6.2 Joint, Marginal, and Conditional Probability ............................................................................... 10
6.3 Probability Rules and Trees ......................................................................................................... 10
7. Random variables and Discrete probability distributions (1) ............................................................ 11
7.1 Random variables and probability Distributions ......................................................................... 11
7.4 Binomial Distribution................................................................................................................... 12
8. Continuous probability distributions (1) ........................................................................................... 13
8.1 Probability Density Functions ...................................................................................................... 13
8.2 Normal Distribution ..................................................................................................................... 13
9. Sampling Distributions (2) ................................................................................................................. 13
9.1 Sampling Distribution of the mean ............................................................................................. 13
9.2 Sampling distribution of a proportion ......................................................................................... 14
9.3 Sampling Distribution of the difference between two means .................................................... 15
9.4 From here to Inference ............................................................................................................... 15
10. Introduction to estimation (2) ......................................................................................................... 15
10.1 Concepts of estimation ............................................................................................................. 15

, 10.2 Estimating the population mean when the population standard deviation is known.............. 16
10.3 Selecting the sample size .......................................................................................................... 16
11. Introduction to hypothesis testing (2)............................................................................................. 17
11.1 Concepts of Hypothesis Testing ................................................................................................ 17
11.2 Testing the population mean when the population standard deviation is know ..................... 17
11.4 The road Ahead ......................................................................................................................... 18
12. Inference about a population (3) .................................................................................................... 18
12.1 Inference about a population mean when the standard deviation is unknown....................... 18
12.2 Inference about a population variance ..................................................................................... 19
12.3 Inference about a population proportion ................................................................................. 19
13. Inference about comparing two populations (3) ............................................................................ 20
13.1 Inference about the difference between two means: independent samples .......................... 20
13.2 Observational and experimental data ....................................................................................... 21
13.3 Inference about the difference between two means: Matched Pairs Experiment .................. 21
13.4 Inference about the Ratio of Two Variances ............................................................................. 22
13.5 Inference about the Difference between two population proportions .................................... 22
15. Chi-squared tests (4) ....................................................................................................................... 23
15.1 Chi-squared goodness-of-Fit Test.............................................................................................. 23
15.2 Chi-Squared test of a Contingency Table .................................................................................. 24
15.3 Summary of Tests on Nominal Data .......................................................................................... 24
19. Nonparametric Statistics (4) ............................................................................................................ 25
19.1 Wilcoxon Rank Sum Test ........................................................................................................... 25
19.2 Sign test and Wilcoxon Signed rank Sum test ........................................................................... 25
19.4 Spearman Rank Correlation Coefficient .................................................................................... 26
16. Simple linear regression and correlation (5) ................................................................................... 26
16.1 Model ........................................................................................................................................ 26
16.2 Estimating the Coefficients........................................................................................................ 27
16.3 Error Variable: Required Conditions ......................................................................................... 27
16.4 Assessing the Model .................................................................................................................. 27
16.5 Using the regression equation .................................................................................................. 29
17. Multiple Regression (5) ................................................................................................................... 29
17.1 Model and Required Conditions................................................................................................ 29
17.2 Estimating the coefficients and Assessing the model ............................................................... 29

,1. What is statistics? (1)
1.1 Key Statistical Concepts
Population
A population is the group of all items of interest tot a statistics practitioner. A descriptive measure of
a population is called a parameter.

Sample
A Sample is a set of drawn from the studied population. A descriptive measure of a sample is called a
statistic.

Statistical inference
Statistical inference is the process of making an estimate, prediction, or decision about a population
based on sample data.
However, such conclusions and estimates are not always going to be correct. For this reason, we
build into the statistical inference a measure of reliability. There are two such measures: the
confidence level and the significance level. The confidence level is the proportion of the times that an
estimating procedure will be correct.

For example, we will produce an estimate of the average number of soft drinks to be consumed by all
50,000 students that has a confidence level of 95%. In other words, estimates based on this form of
statistical inference will be correct 95% of the time.

When the purpose of the statistical inference is to draw a conclusion about a population, he
significance level measures how frequently the conclusion will be wrong.

1.2 Statistical applications in Business
-
1.3 Large real data sets
-


2. Graphical Descriptive Techniques I (1)
2.1 Types of data and information
Types of Data
Interval
- Values are real numbers
- All calculations are valid
- Data may be treated as ordinal or nominal
Ordinal
- Values must represent the ranked order of the data
- Calculations based on an ordering process are valid
- Data may be treated as nominal but not as interval
Nominal
- Values are the arbitrary numbers that represent categories.
- Only calculations based on the frequencies or percentages of occurrence are valid
- Data may not be treated as ordinal or interval.

, 2.2 Describing a set of nominal data
We can summerize the data in a table, which presents the categories and their counts, called as
frequency distribution a relative frequency distribution lists the categories and the proportion with
which each occrurs. We can use graphical techniques to present a picture of the data. There are two
graphical methods we can use: the bar chart and the pie chart. A bar chart is often used to display
frequencies; a pie chart graphically shows relative frequencies.

Factors that identify when to use frequency and relative frequency tables, bar and pie charts.
1. Objective: Describle a single set of data
2. Data type: Nominal or ordinal

2.3 Describing the relationship between two nominal variables and comparing
two or more nominal data sets
Techniques applied to single sets of data are called univariate. There are many situations where we
wish to depict the relationship between vaiables; in such cases, bivariate methods are required. A
cross-classification table (also called a cross-tabulation table) is used to describe the relationship
between two nominal variables.

Factors that identify when to use a cross-classification table
1. Objective: Describe the relationship between two variables and compare two or more sets of
data
2. Data type: Nominal


3. Graphical descriptive techniques II (1)
3.1 Graphical techniques to describe a set of interval data
We create a frequency distribution for interval data by counting the number of observations that fall
into each of a series of intervals, called classes, that cover the complete range of observations. We
discuss how to decide the number of classes and the upper and lower limits of the intervals later.

Although the frequency distribution provides information about how the numbers are distributed,
the information is more easily understood and imparted by drawing rectangles whose bases are the
intervals and whose heights are the frequencies.

Class Interval Widths
We determine the approximate width of the classes by subtracting the smallest observation from the
largest and dividing the difference by the number of classes. Thus,
𝐿𝑎𝑟𝑔𝑒𝑠𝑡 𝑂𝑏𝑠𝑒𝑟𝑣𝑎𝑡𝑖𝑜𝑛 − 𝑆𝑚𝑎𝑙𝑙𝑒𝑠 𝑜𝑏𝑠𝑒𝑟𝑣𝑎𝑡𝑖𝑜𝑛
𝐶𝑙𝑎𝑠𝑠 𝑤𝑖𝑑𝑡ℎ =
𝑁𝑢𝑚𝑏𝑒𝑟 𝑜𝑓 𝐶𝑙𝑎𝑠𝑠𝑒𝑠

Symmetry
A histogram is said to be symmetric if, when we draw a vertical line down the center of the
histogram, the two sides are identical in shape and size

Skewness
A skewed histogram is one with a long tail extending to either the right or the left. The former is
called positively skewed, and the latter is called negatively skewed.

Number of modal classes

The benefits of buying summaries with Stuvia:

Guaranteed quality through customer reviews

Guaranteed quality through customer reviews

Stuvia customers have reviewed more than 700,000 summaries. This how you know that you are buying the best documents.

Quick and easy check-out

Quick and easy check-out

You can quickly pay through credit card or Stuvia-credit for the summaries. There is no membership needed.

Focus on what matters

Focus on what matters

Your fellow students write the study notes themselves, which is why the documents are always reliable and up-to-date. This ensures you quickly get to the core!

Frequently asked questions

What do I get when I buy this document?

You get a PDF, available immediately after your purchase. The purchased document is accessible anytime, anywhere and indefinitely through your profile.

Satisfaction guarantee: how does it work?

Our satisfaction guarantee ensures that you always find a study document that suits you well. You fill out a form, and our customer service team takes care of the rest.

Who am I buying these notes from?

Stuvia is a marketplace, so you are not buying this document from us, but from seller Arjan456. Stuvia facilitates payment to the seller.

Will I be stuck with a subscription?

No, you only buy these notes for $3.21. You're not tied to anything after your purchase.

Can Stuvia be trusted?

4.6 stars on Google & Trustpilot (+1000 reviews)

52510 documents were sold in the last 30 days

Founded in 2010, the go-to place to buy study notes for 14 years now

Start selling
$3.21  3x  sold
  • (0)
Add to cart
Added