100% satisfaction guarantee Immediately available after payment Both online and in PDF No strings attached
logo-home
Samenvatting MMSR Videolectures & Assignments - Methodology Marketing Strategic Management Research - RU - MAN-MMA032A $6.96
Add to cart

Summary

Samenvatting MMSR Videolectures & Assignments - Methodology Marketing Strategic Management Research - RU - MAN-MMA032A

 19 purchases
  • Course
  • Institution

Een samenvatting van het vak Methodology Marketing & Strategic Management Research. De samenvatting gaat over de lectures en de assignments en verduidelijkt de stof d.m.v. screenshots uit SPSS/ de assignments. Deze samenvatting is geschreven in het Engels.

Preview 5 out of 27  pages

  • January 23, 2022
  • 27
  • 2021/2022
  • Summary
avatar-seller
GENERAL (INCLUDING OVERVIEW OF LAST CLASS)

Think in constructs not only in indicators (i.e. observable variables). Rely on theory to understand
what kind of indicators are important to take into account.


Combining quantitative methods and theories: a mixed methods approach.
Conceptualizing and identifying key variables: provides a conceptual foundation and understanding
of the basic processes underlying the problem situation. These processes will suggest key dependent
and independent variables.
Operationalizing key variables: provides guidance for the practical means to measure or encapsulate
the concepts or key variables identified.
Selecting a research design: causal or associative relationships suggested by the theory may indicate
whether a causal, descriptive, or exploratory research design should be adopted.
Selecting a sample: helps in defining the nature of a population, characteristics that may be used to
stratify populations or to validate samples.
Analysing and interpreting data: theoretical framework and models, research questions and
hypotheses based on guide the selection of a data analysis strategy and the interpretation of results.
Integrating findings: the findings obtained in the research project can be interpreted in the light of
previous research and integrated with the existing body of knowledge.

Relationship Technique Measurement scale Types

Interdependence Factor analysis Metric’s variance Exploratory: PC, PFA
Confirmatory: Mplus,
Lisrel, AMOS, STATA

Dependence Multiple regression Metric y, ‘metric x’s Linear regression

Logistic regression Non-metric y, metric x’s

(M)An(c)ova Metric y(‘s), (non)metric x’s

Partial Least Squared Multiple metric y’s en x’s Smartspls, MPlus

Multivariate analysis: all statistical techniques that simultaneously analyze multiple measurements
on individuals or objects under investigation (more than two variables). Hereby, the variate is the
building block of the analysis, a linear combination of variables with empirically determined weights.
Measurement scales are used for the identification and measurement of variation in a set of
variables. Metric: nominal and ordinal. Non-metric: interval and ratio.

,Statistical power: the probability of correctly rejecting the null hypothesis when it should be
rejected. The power is determined by three factors:
- Effect size - helps determine of effect is meaningful
- Alpha - as alpha becomes more restrictive, power decreases
- Sample size - bigger sample sizes give more power

Technique Model statistics (Goodness of fit) Parameter statistics

Factor analysis Eigenvalue, % explained variance Communalities
Factor loadings

Multiple regression R-square B-coefficient, beta
F-test(df1,df2) T-statistic (df2)

Logistic regression Deviance measures: 2LL, Likelihood B-coefficient
Ratio-test Odds Ratio: Exp(B)
Pseudo R-square Wald-statistic

(M)An(c)ova Eta-squared Coefficients
F-test (df1,df2) T-test (df2)

Partial least squared Measurement: reliability, AVE Loadings
Structural: R-squared Path-coefficients, total effect, f2;
t-statistic (df2)


KEY TERMS
Alpha (α): Significance level associated with the statistical testing of the differences between two or
more groups. (probability interval)
Beta: Significance level associated with the statistical testing of differences between two or more
groups. (1-alpha = beta)

Dependence technique: Classification of statistical techniques distinguished by having a variable or
set of variables identified as the dependent variable and the remaining variables as independent.
Example, regression analyses.
Interdependence technique: Classification of statistical techniques in which the variables are not
divided into dependent and independent sets; rather, all variables are analyzed as a single set.
Example, factor analysis.
Summated scales: Method of combining several variables that measure the same concept into a
single variable in an attempt to increase the reliability of the measurement. (Most cases the mean is
used)

Indicator: Single variable used in conjunction with one or more other variables to form a composite
measure.
Variate: A linear combination of measured variables that represents a latent construct.
Treatment: Independent variable (factor) that a researcher manipulates to see the effect (if any) on
the dependent variables. The treatment variable can have several levels. For example, different
intensities of advertising appeals might be manipulated to see the effect on consumer believability.

Measurement error: Inaccuracy in measuring the ‘true’ variables values due to the shortcoming of
measurement instruments, data entry errors, or respondent errors.

,Type 1 error: Probability of incorrectly rejecting the null hypothesis - in most cases, it means saying a
difference or correlation exists when it actually does not.
Type 2 error: Probability of incorrectly failing to reject the null hypothesis - in simple terms, the
chance of not finding a correlation or mean difference when it does exist.
Multicollinearity: Extent to which a variable can be explained by the other variables in the analysis
Power: Probability of identifying a treatment effect when it actually exists in the sample.
Effect size: Estimate of the degree to which the phenomenon being studied, exists in the population.

Reliability: Extent to which a variable or set of variables is consistent in what it is intended to
measure. If multiple measurements are taken, reliable measures will all be consistent in their values.
It differs from validity in that it does not relate to what should be measured, but instead to how it is
measured.
Validity: Extent to which a measure or set of measures correctly represent the concept of study - the
degree to which it is free from any systematic or nonrandom error. Validity is concerned with how
well the concept is defined by the measures, contrasting reliability which relates to the consistency
of the measure.

ADDITIONAL INFORMATION
Fixed factors: test the effect of pre-determined levels of the categories, fixed in advance of the
(experimental) study. In the assignment, only 3 industries is looked at. Random factors: contain a
limited sample of categories of a general population of possible categories.

Control variable: are the determinants that are not vocal to the central hypothesis. Covariate: te
metric control variable.  provide explanation of how other determinates effect the hypothesis.
- In an experiment: covariates, or covariate analysis Use of regression-like procedures to
remove extraneous variation in the dependent variables due to one or more uncontrolled
metric independent variables (covariates);

Difference between moderator and control variable.
Control variable: (e.g. size of company). Moderator
(interaction effect): influences/ moderates an effect of
another variable (e.g. industry effects the impact of
MNC on Business performance. Look around page 373

Confound variable: An omitted variable from the analysis which is related to both factor/treatment
and outcome such that it acts as another “cause” for the main effect. Its omission calls into question
whether the treatment  outcome relationship is valid or if the confound is the true explanation.
- Variable that is not at all in the analysis, which has an impact on the independent and
dependent variable and works as another cause. E.g. more ice cream consumption leads to
more drowning in pools. Confounding variable is the condition of the weather.

,FACTOR ANALYSIS
A statistical method used to describe variability among observed correlated variables in terms of a
potentially lower number of unobserved variables called factors (interdependence technique).
Searches for joint variations (underlying structures) in response to unobserved latent variables. Used
to assess validity and reliability.

Purpose: estimate a model which explains variance/covariance between a set of observed variables
(in a population) by a set of (fewer) unobserved factors and weightings.
- Understand how the variance/covariance interrelates with the observed variables. And want
to understand how the unobserved variables play a role in this data set.

How do gra123 together form the perception of fair grading  factor
analysis.

Factor analysis: anything where you would like to understand higher order dimensions.
- Interdependence technique (how are the variables interrelated, not interested in prediction);
define structure among variables; interrelations among large numbers of variables to identify
underlying dimension (which are called the factors).
- Why do we do this? Data summarization (defining small number of factors that adequately
represents the original variable) and data reduction (identifying representative variables
from a much larger set).

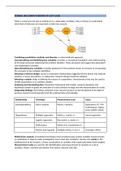
Measurement model: E1: construct / X11,12,13:
items / E21,22,23: measurement error. Picture
shows 4 construct with different items.
Multi-item measurement: (1) Increases reliability
and validity of measures. (2) Makes it possible to
assess the measurement error.

Reliability and validity: On target and clustered. Reliable, not valid:
cluster together but are not on target. Valid, not reliable: on target, but
spread out. Neither valid nor reliable: not on target and not clustered.

Two forms of measurement models: Reflective is used mostly.
- Reflective measurement models (emergent):
o Use direction of causality from the construct to the measure; are correlated
indicators (items correlate and these correlations are used in the factor analysis);
takes measurement error into account at the item level;
o the validity of items is usually tested with factor analysis.
- Formative measurement models (latent)

Applications: assess the validity of construct measurements (e.g. thesis), also widely used in practice
(e.g. market segmentation, product research, price management).

1. Problem formulation
A. Identify objectives: data summarization or data reduction
B. Determines which variables we are going to measure (based on past research, theory, and
judgement of the research)
C. Requirements:
a. Measurement properties: need to be interval or ratio
b. Sample size: 4-5 per variable, with a minimum of 50

, c. Missing values: < 10%
D. Distinguish between exploratory factor analysis and confirmatory factor analysis.
a. Exploratory factor analysis (EFA): finding an underlying structure; you don’t know
much about the structure yet; assumptions that superior factors cause correlation
between variables; reveal hypothesis; generate hypothesis.  Two type of
specifications: principal components analysis and common factor analysis. See
bottom left side of blue figure above.
o Confirmatory factor analysis (CFA): a priori ideas of underlying factors, derived from
theory; expectation about relationship between variables and factors; testing
hypothesis. See top left side of blue figure above.

2. Constructing correlation matrix / preparation
A. Analytical process that is based on a matrix of correlations between the variables.
B. To identify whether this correlation matrix can be used for factor analysis/ whether factor
analysis is a suitable technique to use.
a. Keyser-Meyer-Olkom (KMO): measure of sampling adequacy of population.
i. Accepted when > 0.5 (closer to 1, the better)
b. Barlett’s test of sphericity: test the null hypothesis that the variables are
uncorrelated in the population. H0 accepted: no correlation in the population, factor
analysis is not possible  H0 needs to be rejected.
i. Accepted = sign. < 0.05 (then we have enough correlation)


3. Selecting extraction method
Method Goal

Principal Component Analysis Data reduction Total variance considered

Common Factor Analysis Data summarization Error variance is considered
A. Principal components analysis: looks at the total variance in the data. The diagonal of the
correlation matrix consists of unities. The full variance is brought into the factor matrix.
a. Concern: minimum number of factors will account for maximum variance (always
tries to maximize explained variance).
b. Factors are called principal components.
c. Mathematically, each variable is expressed as a linear combination of the
components. The covariation among the variables is described in terms of a small
number of principal components. If the variables are standardized, the principal
component model may be represented as:

The benefits of buying summaries with Stuvia:

Guaranteed quality through customer reviews

Guaranteed quality through customer reviews

Stuvia customers have reviewed more than 700,000 summaries. This how you know that you are buying the best documents.

Quick and easy check-out

Quick and easy check-out

You can quickly pay through credit card or Stuvia-credit for the summaries. There is no membership needed.

Focus on what matters

Focus on what matters

Your fellow students write the study notes themselves, which is why the documents are always reliable and up-to-date. This ensures you quickly get to the core!

Frequently asked questions

What do I get when I buy this document?

You get a PDF, available immediately after your purchase. The purchased document is accessible anytime, anywhere and indefinitely through your profile.

Satisfaction guarantee: how does it work?

Our satisfaction guarantee ensures that you always find a study document that suits you well. You fill out a form, and our customer service team takes care of the rest.

Who am I buying these notes from?

Stuvia is a marketplace, so you are not buying this document from us, but from seller tessapeters2. Stuvia facilitates payment to the seller.

Will I be stuck with a subscription?

No, you only buy these notes for $6.96. You're not tied to anything after your purchase.

Can Stuvia be trusted?

4.6 stars on Google & Trustpilot (+1000 reviews)

64450 documents were sold in the last 30 days

Founded in 2010, the go-to place to buy study notes for 15 years now

Start selling
$6.96  19x  sold
  • (0)
Add to cart
Added