MATH 225N week 8 stats questions module Correlation,Answered & Corrected.
5 views 0 purchase
Course
MATH 225N (MATH225N)
Institution
Chamberlain College Of Nursing
Question
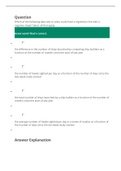
Which of the following data sets or plots could have a regression line with a
negative slope? Select all that apply.
Great work! That's correct.
the difference in the number of ships launched by competing ship builders as a
function of the number of months since the start of last...
math 225n week 8 stats questions module correlation
answered amp corrected
math 225n week 8 stats questions module correlation
week 8 stats questions module correlation
Written for
Chamberlain College Of Nursing
MATH 225N (MATH225N)
All documents for this subject (550)
Seller
Follow
Michael01
Reviews received
Content preview
Question
Which of the following data sets or plots could have a regression line with a
negative slope? Select all that apply.
Great work! That's correct.
the difference in the number of ships launched by competing ship builders as a
function of the number of months since the start of last year
the number of hawks sighted per day as a function of the number of days since the
two-week study started
the total number of ships launched by a ship builder as a function of the number of
months since the start of last year
the average number of hawks sighted per day in a series of studies as a function of
the number of days since the ten-week study started
Answer Explanation
, Correct answer:
the difference in the number of ships launched by competing ship builders as a
function of the number of months since the start of last year
the number of hawks sighted per day as a function of the number of days since the
two-week study started
the average number of hawks sighted per day in a series of studies as a function of
the number of days since the ten-week study started
The slope is related to the increase or decrease of the dependent variable as a
function of the independent variable. If the dependent variable can decrease, then
the slope can be negative, such as with the difference in the number of ships
launched.
Question
The scatter plot below shows the average cost of a designer jacket in a sample of
years between 2000 and 2015. The least squares regression line modeling this
data is given by yˆ=−4815+3.765x.
The benefits of buying summaries with Stuvia:
Guaranteed quality through customer reviews
Stuvia customers have reviewed more than 700,000 summaries. This how you know that you are buying the best documents.
Quick and easy check-out
You can quickly pay through credit card or Stuvia-credit for the summaries. There is no membership needed.
Focus on what matters
Your fellow students write the study notes themselves, which is why the documents are always reliable and up-to-date. This ensures you quickly get to the core!
Frequently asked questions
What do I get when I buy this document?
You get a PDF, available immediately after your purchase. The purchased document is accessible anytime, anywhere and indefinitely through your profile.
Satisfaction guarantee: how does it work?
Our satisfaction guarantee ensures that you always find a study document that suits you well. You fill out a form, and our customer service team takes care of the rest.
Who am I buying these notes from?
Stuvia is a marketplace, so you are not buying this document from us, but from seller Michael01. Stuvia facilitates payment to the seller.
Will I be stuck with a subscription?
No, you only buy these notes for $15.99. You're not tied to anything after your purchase.