The Hardy-Weinberg Equation
How can we make predictions about the characteristics of a population?
Why?
Punnett squares provide an easy way to predict the possible genotypes for an offspring, but it is not
practi-cal to perform a Punnett square analysis on all possible combinations of all members of a
population to predict what the population might look like in the future. For that we must turn to
statistics. The Hardy-Weinberg equation is a tool biologists use to make predictions about a
population and to show whether or not evolution is occurring in that population.
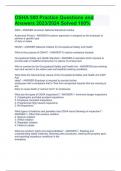
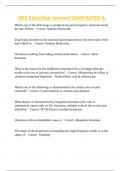
Model 1 – Controlled (Selective) Mating
Males Females Males Females
B
Bb bb Bb bb bb Bb bb b
B
Bb bb Bb bb bb Bb bb b
B
Bb bb Bb bb bb Bb bb b
1.
This study source was downloaded by 100000836551366 from CourseHero.com on 02-21-2022 04:06:06 GMT -06:00
https://www.coursehero.com/file/37906367/POGIL-The-Hardy-Weinberg-Equation-S-1docx/
, 1.How many mating pairs are illustrated in Model 1?
In model 1 there’s 12 mating pairs.
2. Describe the parents in each mating pair in Model 1. Use terms such as homozygous, heterozygous,
dominant, and recessive.
The first group is heterozygous and homozygous, one parent is heterozygous and the other is
homozygous.
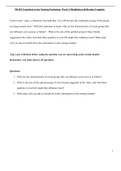
3. Use two Punnett squares to determine the possible genotypes for offspring from the pairs.
First couple
b b
B Bb Bb
b bb bb
The Hardy-Weinberg Equation 1
4. If each mating pair has one offspring, predict how many of the first generation offspring will have the
following genotypes.
BB 0 Bb 6 bb 6
5. Imagine the 24 beetles in Model 1 as a population in an aquarium tank.
a. How likely is the pairing scenario in Model 1 to take place during the natural course of things
within that tank?
The pairing scenario in model 1 takes is very unlikely.
b. Why is Model 1 labeled “Selective Mating”?
Model one is labeled selective mating because they only mate with other members of the
population who have a certain trait.
Bb and Bb bb and bbb
This study source was downloaded by 100000836551366 from CourseHero.com on 02-21-2022 04:06:06 GMT -06:00
https://www.coursehero.com/file/37906367/POGIL-The-Hardy-Weinberg-Equation-S-1docx/
How can we make predictions about the characteristics of a population?
Why?
Punnett squares provide an easy way to predict the possible genotypes for an offspring, but it is not
practi-cal to perform a Punnett square analysis on all possible combinations of all members of a
population to predict what the population might look like in the future. For that we must turn to
statistics. The Hardy-Weinberg equation is a tool biologists use to make predictions about a
population and to show whether or not evolution is occurring in that population.
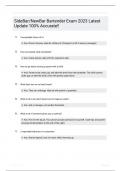
Model 1 – Controlled (Selective) Mating
Males Females Males Females
B
Bb bb Bb bb bb Bb bb b
B
Bb bb Bb bb bb Bb bb b
B
Bb bb Bb bb bb Bb bb b
1.
This study source was downloaded by 100000836551366 from CourseHero.com on 02-21-2022 04:06:06 GMT -06:00
https://www.coursehero.com/file/37906367/POGIL-The-Hardy-Weinberg-Equation-S-1docx/
, 1.How many mating pairs are illustrated in Model 1?
In model 1 there’s 12 mating pairs.
2. Describe the parents in each mating pair in Model 1. Use terms such as homozygous, heterozygous,
dominant, and recessive.
The first group is heterozygous and homozygous, one parent is heterozygous and the other is
homozygous.
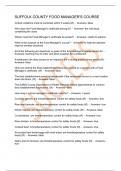
3. Use two Punnett squares to determine the possible genotypes for offspring from the pairs.
First couple
b b
B Bb Bb
b bb bb
The Hardy-Weinberg Equation 1
4. If each mating pair has one offspring, predict how many of the first generation offspring will have the
following genotypes.
BB 0 Bb 6 bb 6
5. Imagine the 24 beetles in Model 1 as a population in an aquarium tank.
a. How likely is the pairing scenario in Model 1 to take place during the natural course of things
within that tank?
The pairing scenario in model 1 takes is very unlikely.
b. Why is Model 1 labeled “Selective Mating”?
Model one is labeled selective mating because they only mate with other members of the
population who have a certain trait.
Bb and Bb bb and bbb
This study source was downloaded by 100000836551366 from CourseHero.com on 02-21-2022 04:06:06 GMT -06:00
https://www.coursehero.com/file/37906367/POGIL-The-Hardy-Weinberg-Equation-S-1docx/