Supply Chain Modelling
Lecture 1 – 02.02.2022
This course is about looking at Supply chain dynamics. It has to do with operations management
(supply), organization & management (network) and system dynamics simulation (dynamics). Today
is about chapter 1,2 and 3.
We need coordination to plan demand and supply. You need collaborative planning, were all
elements work together. That’s why we need a business dynamics mindset. The time horizon should
be multiple years, time series, and long-term. The culture should be more collaborative and not
competitive.
It’s hard for managers to take the right decisions. There are several reasons. One of them is
increasing volatility in the world. Another one is increasing technological complexity. Next, there
increasing interconnectedness. Economics, Politics, Military and Ecology have all an effect on each
other. They are exogenous reasons.
There are several filters: cognitive, behavioural, organizational and strategic filters. These filters we
lay on the reality.
Economic filters: principal-agent, homo economicus.
Cognitive filters: we find it hard to deal with feedback, delays, and accumulations. We are not well
equipped to deal with dynamic complexity. If you change one thing, then it exceeds the amount and
it’s hard to get to the goal result. That’s why we cannot really deal with accumulations (look at trying
to find the right inventory level or cashflow level).
Also look at framing and stuff. Those are behavioural filters. We are fooled often.
Then we have organizational filters. More is not better! Look at the amount of data. Managers do not
know what information they need, managers do not want to escalate and share data, people are
incentivized to manipulate data and data definitions. We pretend we don’t know what’s happening.
Strategic filters. We don’t have time to look at it. Or not enough resources.
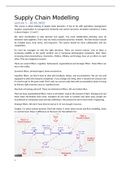
Chapter 2 is about system dynamic (YouTube video). It starts about stocks and flow modelling. Stock
is a certain level. Flows is difference at the level. For the bathtub it is:
1
,Stocks characterise the state of the system. It’s the basis for actions. There’s some inertia and
memory through stocks. That’s why there’s also delays. It’s hide and seek, which creates
disequilibrium.
This is an example of stocks and flows:
There are two types of feedback. Positive (always greater or always smaller). Negative feedback has a
certain goal. Positive is left. Negative is right.
If there’s a proportional death rate (of 20% for example). Then in the end you will come close to zero.
That’s implicit feedback.
Sometimes there’s an explicit goal. Then you have a desired state of a system and a current state of a
system. Inflow rate = desired level – current level. Negative feedback is goal-seeking.
If adjustment time is bigger, the longer it will take to reach the goal. So that’s important to keep in
mind. An outflow can be a certain percentage of the stock. You can also see that when there are
more customers for example (as percentage of stock), then you also have more outflow. So if all is
percentages, it gets more complicated. So this is all about materials delays. The outflow is a
percentage part, defined by the stock of which it’s flowing out.
Then you also have information delays. There’s some perceived value. Current value, and overtime
there’s a change in perception, which reach to the perceived value. Over time, the perceived value
comes closer and closer to the reported value. There’s some delay in processing information. You
smooth out the noise and you smooth out big peaks/lows.
If your way off initially from perspective to reality, then it also takes a lot of time to adjust. It’s the
anchor and adjustment theory. A first impression, really matters a lot.
Causal loop diagram:
2
, As you see there are plusses
and minuses. That’s to describe
the relationship (positive or
negative). R’s are reinforcing
feedback (positive), Balancing
feedback (negative). Positive
loops = all pluses. Uneven
amount of minuses = balancing
feedback.
Oscillation – you want to reach a certain goal, but you overshoot, because of a delay:
You swing back and forth at a regular speed around a certain point. So
you oversteer to one side. You need at least two sources of delays (so
two stocks) for oscillation. There’s un unstable equilibrium: it’s almost
impossible to reach it.
S-shaped:
Overshoot & Collapse:
For example: super popular restaurant gets
less popular, because it’s always so crowded.
3
, Tutorial 1 – 04.02.2022
See pdf file of tutorial 1 (including answers in red).
This is a causal loop diagram (CLD). Including
positive/negative relationship (see right).
This is a stock/flow diagram.
Then go to sidico.
Project (right up) project settings here you can find beginning time and end time.
Right click somewhere Here you can create a lot. You can also just press V for creating
variable or S for creating stock.
You can drag one variable to a flow/stock by dragging your cursor from one to another.
You can click on a stock/variable, where you can find a formula.
If you name a variable “time”, it takes the time on the x-axis.
You can create a chart and you can drag variables to the graph and then it takes this data.
The same applies for a table.
There are several functions:
- Minimum: returns the minimum value of something.
- Maximum: returns the maximum value of something.
- Step -function (number + time (e.g. 50)). Until time 50, it’s zero. From time 50
onwards, it takes the value given.
- Pulse function (number of the pulse, initial pulse when it happens, interval (every so
many times, you see this pulse happening).
- Graphical funcation Lookup Table (via right click somewhere).
Then you can click on the look-up table and find the value of Y,
when you know the value of x. Look at how x is used in the
formula of Y. Then plot that into the lookup table.
Then let’s take a look at feedback loops. You need at least 2 variables that are
connected in a loop of which at least on e is a stock. A change in the first variable will create a
subsequent effect on the first variable over time. They can be reinforcing or balancing. A feedback
loop means that in the end you have a loop; al variables are connected: ABCA. Say all
4
The benefits of buying summaries with Stuvia:
Guaranteed quality through customer reviews
Stuvia customers have reviewed more than 700,000 summaries. This how you know that you are buying the best documents.
Quick and easy check-out
You can quickly pay through credit card or Stuvia-credit for the summaries. There is no membership needed.
Focus on what matters
Your fellow students write the study notes themselves, which is why the documents are always reliable and up-to-date. This ensures you quickly get to the core!
Frequently asked questions
What do I get when I buy this document?
You get a PDF, available immediately after your purchase. The purchased document is accessible anytime, anywhere and indefinitely through your profile.
Satisfaction guarantee: how does it work?
Our satisfaction guarantee ensures that you always find a study document that suits you well. You fill out a form, and our customer service team takes care of the rest.
Who am I buying these notes from?
Stuvia is a marketplace, so you are not buying this document from us, but from seller liekepbreure. Stuvia facilitates payment to the seller.
Will I be stuck with a subscription?
No, you only buy these notes for $7.95. You're not tied to anything after your purchase.