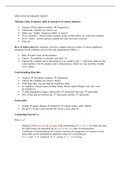
Introduction to Statistical Analysis SPSS Test Summary - IBCOM Year 1
26 views 0 purchase
Course
Introduction To Statistical Analysis (CM1005)
Institution
Erasmus Universiteit Rotterdam (EUR)
Summary of the steps that need to be done for each SPSS test included in the Introduction to Statistical Analysis SPSS test, including definition of the tests, the conclusion format necessary for each of the tests and additional tips.
Making a basic frequency table & measures of central tendency
Analyze descriptive statistics Frequencies
Choose the variable you want to use
Make sure ‘display frequency tables’ is chosen
Go to ‘statistics’: choose mean, median, mode, std deviation, etc. and click continue
Go to ‘charts’: choose anyone, usually bar chart and click continue
Press ok
How to Select cases (for example, you have a dataset that gives data of various happiness
measures for all countries, but you are only interested in Turkey.)
Data select cases (at the bottom)
Choose ‘If condition is satisfied’ and click ‘If…’
Choose the variable you’re interested in (e.g. country), put ‘=’ and write whatever the
code number is for the country you’re interested in, which you can see from variable
view, values.
Understanding Quartiles
Analyze descriptive statistics frequencies
Choose the variable you want to choose
With huge data, you can skip the frequency table
In ‘statistics’ choose mean, median, mode, Std deviation, Range, min, max, and
QUARTILES
To find interquartile range, subtract the 25th percentile from the 75th percentile.
50% of the data lie between the 25th percentile and the 75th percentile
Scatterplots
Graphs legacy dialogs scatter/dot simple scatter, click ‘define’
Put the IV on the x axis and the DV on the y axis, click ok
Calculating Pearson’s r
What is it?
- Measure of the direction & strength of the relationship of two factors in which the data
for both factors are measured on an interval or ratio scale of measurement
- Coefficient of determination (R2): used to measure the proportion of variance of one
factor that can be explained by unknown values of a second factor
- 0-.3 - weak, .3-.6 - moderate .6-.8 - strong .8 - 1 - very strong
, Steps
Analyze – Correlate – Bivariate
Pick your two variables
Pick ‘pearson’ as the Correlation Coefficient, pick ‘two tailed’, check the flag significant
correlations, click ok
Evaluate the direction and the strength of the correlation
Creating New variables (allows for between group comparison)
Transform –> recode into DIFFERENT variables
Choose the variable you want to code into different groups
Give the new variable a name and click old and new values
Ex. If you want to divide the components of a variable into three groups, there will be
three components in the new variables. The components will be labeled 1, 2, & 3. If the
old variable had 90 data, then the first group (new value = 1) can have the old values of
lowest to 30, the second group (new value = 2) can have the old value range 31-60, and
the third group (new value = 3) can have the old values of 60 through highest.
Once you have created the new variable, you can go to variable view and change the
properties from the labels.
Crosstabs (summarize the relationships between the different variables of categorical data.
Shows the proportion of cases in subgroups)
Analyze descriptive statistics crosstabs
Always put IV in the columns and DV in the rows
Include column percentages for easy interpretation
Go to cells, pick ‘Observed’ in counts and ‘column’ in percentages, click continue
Click ok
One sample t test
What is it?
- Used to compare a mean value measured in a sample to a known value in the population
- Specifically used to test hypotheses concerning a single group mean selected from a
population with an unknown variance
- Does the sample lead us to retain or reject the null hypothesis that was made about the
population?
Steps
Compare means one sample t-test
Choose the variable the hypothesis is about
Put the null hypothesis value in the test value, click ok
When analyzing, look at sample mean. Write down t and p (= sig. 2 tailed)
The benefits of buying summaries with Stuvia:
Guaranteed quality through customer reviews
Stuvia customers have reviewed more than 700,000 summaries. This how you know that you are buying the best documents.
Quick and easy check-out
You can quickly pay through credit card or Stuvia-credit for the summaries. There is no membership needed.
Focus on what matters
Your fellow students write the study notes themselves, which is why the documents are always reliable and up-to-date. This ensures you quickly get to the core!
Frequently asked questions
What do I get when I buy this document?
You get a PDF, available immediately after your purchase. The purchased document is accessible anytime, anywhere and indefinitely through your profile.
Satisfaction guarantee: how does it work?
Our satisfaction guarantee ensures that you always find a study document that suits you well. You fill out a form, and our customer service team takes care of the rest.
Who am I buying these notes from?
Stuvia is a marketplace, so you are not buying this document from us, but from seller idiloral2003. Stuvia facilitates payment to the seller.
Will I be stuck with a subscription?
No, you only buy these notes for $5.94. You're not tied to anything after your purchase.