100% satisfaction guarantee Immediately available after payment Both online and in PDF No strings attached
logo-home
Samenvatting Statistiek B (Cijfer 9,0) | Pre-Master Gezondheidswetenschappen | Erasmus Universiteit Rotterdam $7.49
Add to cart

Summary

Samenvatting Statistiek B (Cijfer 9,0) | Pre-Master Gezondheidswetenschappen | Erasmus Universiteit Rotterdam

 49 views  2 purchases
  • Course
  • Institution

en samenvatting van het vak Statistiek B gegeven in de Pre-Master Gezondheidswetenschappen aan de Erasmus Universiteit Rotterdam. Deze samenvatting bevat de stof gegeven in de colleges met aanvullingen vanuit de verplichte literatuur. Belangrijke termen zijn weergegeven in het oranje en andere kern...

[Show more]
Preview 2 out of 15  pages

  • April 20, 2022
  • 15
  • 2021/2022
  • Summary
avatar-seller
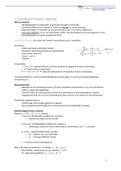
1 Correlatie en lineaire regressie
Wat en waarom?
- Spreidingsdiagram (scatterplot) → grafische weergave samenhang
- Correlatiecoëfficiënt en -analyse → maat voor sterkte van de samenhang
- Regressieanalyse → methode om de samenhang tussen 2 (of meer) variabelen te
beschrijven/bepalen m.b.v. een functionele relatie. Het schat/tekent een lijn die gegevens in het
spreidingsdiagram zo goed mogelijk beschrijft.

Correlatiecoëfficiënt: een maat voor lineaire samenhang tussen 2 variabelen.

Kenmerken:
- Onderzoekt geen oorzakelijk verband
- Variabelen tenminste gemeten op intervalniveau
- Index zonder dimensie
- Tussen -1 en +1
- Ordinaal

Interpretatie:
- r = 1 of -1 → respectievelijk een perfecte positieve of negatieve lineaire samenhang
- r = 0 → geen lineaire samenhang
- 0 < r < 1 of -1 < r < 0 → respectievelijk positieve of negatieve lineaire samenhang.

Correlatiecoëfficiënt = aantal standaardafwijking veranderingen in y voor een standaardafwijking
verandering in x.

Regressieanalyse
- Methode om de samenhang tussen 2 of meer variabelen te beschrijven m.b.v. een functionele
relatie (= regressievergelijking).
- Techniek levert de ‘best passende’ lijn die de puntenwolk (zie spreidingsdiagram) zo goed
mogelijk beschrijft om o.a. een voorspelling te doen en/of om een theorie te vormen/toetsen.

Onderdelen regressieanalyse:
- Enkelvoudig, meervoudig, logistische regressie
- Keuze (regressiemodel) hangt af van meetniveau van de afhankelijke variabele

(Enkelvoudige) lineaire regressie
Notatie: 𝑦 = 𝛽0 + 𝛽1 ∗ 𝑥 + 𝑒 waarbij
- Y (op y-as): afhankelijke variabele (of: outcome)
o Meetniveau altijd interval of ratio.

- X (op x-as): onafhankelijke variabele (of: exposure)
o Meetniveau interval of ratio, indien anders: herdefiniëren als 0 – 1 variabele.

- 𝛽0 en 𝛽1 = regressiecoëfficiënten waarbij:
o 𝛽0 = snijpunt met y-as (intercept)
o 𝛽1 = richtingscoëfficiënt (slope)

- e = residu (error/voorspellingsfout)

Wat is de ‘best passende lijn’? → Ideaal: 𝑦 = 𝛽0 + 𝛽1 ∗ 𝑥
- Beschikbaar: meetpunten (xi, yi), waarbij i = 1 of 2
- En: regressievergelijking: 𝑦 ′ = 𝛽0 + 𝛽1 ∗ 𝑥


1

, Fout in voorspelling: residuen (afstand meetpunten tot voorspelde regressielijn)
Gezocht: de lijn waarbij het kwadraat van de afstanden van alle punten
tot de lijn zo goed mogelijk is (kwadratencriterium).
Uitgaande van het kleinste kwadratencriterium kan wiskundig de
vergelijking voor de beste lijn worden afgeleid, we gebruiken daarvoor
𝑥̅ en 𝑦̅.

Stappenplan enkelvoudige lineaire regressie
1. Bepaal de toets
a. Meetniveau variabelen:
i. Meetniveau afhankelijke variabele (y): ratio
ii. Meetniveau onafhankelijke variabele (x): ratio
iii. Lineaire regressievergelijking → toets op 𝛽1

2. Hypothese
a. H0: 𝛽1 = 0
b. Ha: 𝛽1 ≠ 0

3. Toetsingsgrootheid
𝛽1
a. Toetsingsgrootheid = t = schatter voor 𝑆.𝐸.

4. Neem beslissing
a. P-waarde = 0.008 (tweezijdig)
b. P-waarde = < 0.05 (= alfa)
➔ H0 verwerpen

5. Conclusie verwoorden


2

The benefits of buying summaries with Stuvia:

Guaranteed quality through customer reviews

Guaranteed quality through customer reviews

Stuvia customers have reviewed more than 700,000 summaries. This how you know that you are buying the best documents.

Quick and easy check-out

Quick and easy check-out

You can quickly pay through credit card or Stuvia-credit for the summaries. There is no membership needed.

Focus on what matters

Focus on what matters

Your fellow students write the study notes themselves, which is why the documents are always reliable and up-to-date. This ensures you quickly get to the core!

Frequently asked questions

What do I get when I buy this document?

You get a PDF, available immediately after your purchase. The purchased document is accessible anytime, anywhere and indefinitely through your profile.

Satisfaction guarantee: how does it work?

Our satisfaction guarantee ensures that you always find a study document that suits you well. You fill out a form, and our customer service team takes care of the rest.

Who am I buying these notes from?

Stuvia is a marketplace, so you are not buying this document from us, but from seller et98. Stuvia facilitates payment to the seller.

Will I be stuck with a subscription?

No, you only buy these notes for $7.49. You're not tied to anything after your purchase.

Can Stuvia be trusted?

4.6 stars on Google & Trustpilot (+1000 reviews)

61231 documents were sold in the last 30 days

Founded in 2010, the go-to place to buy study notes for 15 years now

Start selling
$7.49  2x  sold
  • (0)
Add to cart
Added