100% satisfaction guarantee Immediately available after payment Both online and in PDF No strings attached
logo-home
Experimenteel en Correlationeel Onderzoek SPSS Stappenplan $3.21
Add to cart

Other

Experimenteel en Correlationeel Onderzoek SPSS Stappenplan

 3 views  0 purchase
  • Course
  • Institution

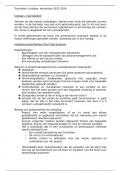
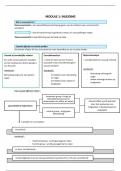
In dit document vind je een stappenplan wat gebruikt kan worden bij het maken van SPSS-opdrachten bij het vak Experimenteel en Correlationeel Onderzoek (Psychologie, jaar 1, blok 3). In het geel staan de opdrachten met daaronder de handelingen op volgorde. De uitgewerkte stappen zijn gebaseerd op h...

[Show more]

Preview 1 out of 4  pages

  • April 28, 2022
  • 4
  • 2020/2021
  • Other
  • Unknown
avatar-seller
SPSS ECO STAPPENPLAN
Week 4
- correlatie berekenen
o Pearson r, Punt-biseriële correlatie & phi-coëfficiënt
analyze→correlate→bivariate→ plaats variabelen in variable box → klik pearson r → kijk of
je eenzijdig of tweezijdig wil toetsen → OK
o & Spearman rho

analyze→correlate→bivariate→ plaats variabelen in variable box → klik Spearman aan →
kijk of je eenzijdig of tweezijdig wil toetsen → OK
--p-waarde vind je in de rij ‘sig.’
--Pearson r/Spearman rho: df = N-2
- scatterplot maken
graphs→legacy dialogs→scatter/dot→simple scatter→ define→vul X en Y in→OK


- maak regressielijn
maak scatterplot → dubbelklik voor chart editor → add fit line at total
→ fill line: linear → close →chart editor sluiten:
klik op kruisje


--op de regressielijn zie je ook de
regressieformule
--bij properties kun je ook het
betrouwbaarheidsinterval aanpassen, klik op
mean(gemiddelde) /individual (individu)

- voer enkelvoudige lineaire regressieanalyse uit
analyze→regression→linear→dependent & independent variable invoeren → klik op
statistics: klik aan wat je nodig hebt (betrouwbaarheidsinterval bv) → OK
--independent = X, dependent = Y
-- hier kun je ook het betrouwbaarheidsinterval van de slope (B1) & intercept
(B0=constant) mee rapporteren.
-- t-waarde van de predictor vindt je in onderste rij.
o VAF: kijk bij R square in Model Summary
o geschatte VAF van de populatie: kijk bij adj R square

The benefits of buying summaries with Stuvia:

Guaranteed quality through customer reviews

Guaranteed quality through customer reviews

Stuvia customers have reviewed more than 700,000 summaries. This how you know that you are buying the best documents.

Quick and easy check-out

Quick and easy check-out

You can quickly pay through credit card or Stuvia-credit for the summaries. There is no membership needed.

Focus on what matters

Focus on what matters

Your fellow students write the study notes themselves, which is why the documents are always reliable and up-to-date. This ensures you quickly get to the core!

Frequently asked questions

What do I get when I buy this document?

You get a PDF, available immediately after your purchase. The purchased document is accessible anytime, anywhere and indefinitely through your profile.

Satisfaction guarantee: how does it work?

Our satisfaction guarantee ensures that you always find a study document that suits you well. You fill out a form, and our customer service team takes care of the rest.

Who am I buying these notes from?

Stuvia is a marketplace, so you are not buying this document from us, but from seller StudySister. Stuvia facilitates payment to the seller.

Will I be stuck with a subscription?

No, you only buy these notes for $3.21. You're not tied to anything after your purchase.

Can Stuvia be trusted?

4.6 stars on Google & Trustpilot (+1000 reviews)

52510 documents were sold in the last 30 days

Founded in 2010, the go-to place to buy study notes for 14 years now

Start selling
$3.21
  • (0)
Add to cart
Added