100% satisfaction guarantee Immediately available after payment Both online and in PDF No strings attached
logo-home
ALC 9 Quantitative Research Techniques $14.49   Add to cart

Exam (elaborations)

ALC 9 Quantitative Research Techniques

 2 views  0 purchase
  • Course
  • Institution

-You take a random sample of 100 students at your university and find that their average GPA is 3.1. If you use this information to help you estimate the average GPA for all students at your university, then you are doing what branch of statistics? Descriptive statistics Inferential statistics...

[Show more]

Preview 4 out of 53  pages

  • May 16, 2022
  • 53
  • 2021/2022
  • Exam (elaborations)
  • Questions & answers
avatar-seller
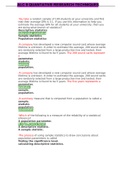
ALC 9 QUANTATIVE RESEARCH TECHNIQUES


-You take a random sample of 100 students at your university and find
that their average GPA is 3.1. If you use this information to help you
estimate the average GPA for all students at your university, then you
are doing what branch of statistics?
Descriptive statistics
Inferential statistics
Sample statistics
Population statistics

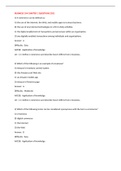
-A company has developed a new computer sound card whose average
lifetime is unknown. In order to estimate this average, 200 sound cards
are randomly selected from a large production line and tested; their
average lifetime is found to be 5 years. The 200 sound cards represent
a
parameter.
statistic.
sample.
population.

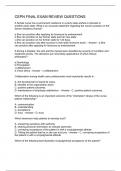
-A company has developed a new computer sound card whose average
lifetime is unknown. In order to estimate this average, 200 sound cards
are randomly selected from a large production line and tested; their
average lifetime is found to be 5 years. The five years represents a
parameter.
statistic.
sample.
population.

-A summary measure that is computed from a population is called a
sample.
statistic.
population.
parameter.

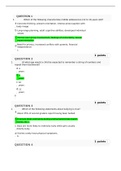
-Which of the following is a measure of the reliability of a statistical
inference?
A population parameter.
A significance level.
A descriptive statistic.
A sample statistic.

-The process of using sample statistics to draw conclusions about
population parameters is called
finding the significance level.
calculating descriptive statistics.

,doing inferential statistics.
calculating the confidence level.

-Which of the following represents a population, as opposed to a
sample?
1,000 respondents to a magazine survey which has 500,000
subscribers.
The first 10 students in your class completing a final exam.
Every fifth student to arrive at the book store on your campus.
All registered voters in the State of Michigan.

-A study in under way to determine the average height of all 32,000
adult pine trees in a certain national forest. The heights of 500
randomly selected adult pine trees are measured and analyzed. The
sample in this study is
the average height of the 500 randomly selected adult pine
trees.
the average height of all the adult pine trees in this forest.
all adult pine trees in this forest.
the 500 adult pine trees selected at random selected at
random from this forest.

-The significance level of a statistical inference measures
the proportion of times a conclusion about a population will be
correct in the long run.
the proportion of times a conclusion about a population will be
wrong in the long run.
the proportion of times an estimation procedure will be correct
in the long run.
the proportion of times an estimation procedure will be wrong
in the long run.


-The confidence level of a statistical inference measures
the proportion of times a conclusion about a population will be
correct in the long run.
the proportion of times a conclusion about a population will be
wrong in the long run.

,the proportion of times an estimation procedure will be correct
in the long run.
the proportion of times an estimation procedure will be wrong
in the long run.

-A marketing research firm selects a random sample of adults and asks
them a list of questions regarding their beverage preferences. What
type of data collection is involved here?
An experiment.
A survey.
Direct observation.
None of these choices

-Which of the following statements is true regarding the design of a
good survey?
The questions should be kept as short as possible.
A mixture of dichotomous, multiple-choice, and open-ended
questions may be used.
Leading questions must be avoided.
All of these choices are true.

-Which method of data collection is involved when a researcher counts
and records the number of students wearing backpacks on campus on
a given day?
An experiment.
A survey.
Direct observation.
None of these choices.

-The difference between a sample mean and the population mean is
called
nonresponse error.
selection bias.
sampling error.
nonsampling error.


-The manager of the customer service division of a major consumer
electronics company is interested in determining whether the
customers who have purchased a videocassette recorder over the past
12 months are satisfied with their products. If there are four different
brands of videocassette recorders made by the company, the best
sampling strategy would be to use a
simple random sample.
stratified random sample.

, cluster sample.
self-selected sample.

-When every possible sample with the same number of observations is
equally likely to be chosen, the result is called a
simple random sample.
stratified random sample.
cluster sample.
biased sample.

-Which of the following types of samples is almost always biased?
Simple random samples.
Stratified random samples.
Cluster samples.
Self-selected samples.

-Which of the following is an example of a nonsampling error?
Some incorrect responses are recorded.
Responses are not obtained from all members of the sample.
Some members of the target population cannot possibly be
selected for the sample.
All of these choices are true.

-Which of the following situations lends itself to cluster samples?
When it is difficult to develop a complete list of the population
members.
When the population members are widely disbursed.
When selecting and collecting data from a simple random
sample is too costly.
All of these choices are true.


-Which of the following causes sampling error?
Taking a random sample from a population instead of studying
the entire population.
Making a mistake in the process of collecting the data.
Nonresponse bias.
All of these choices are true.

-Which of the following describes selection bias?
A leading question is selected for inclusion in the survey.

The benefits of buying summaries with Stuvia:

Guaranteed quality through customer reviews

Guaranteed quality through customer reviews

Stuvia customers have reviewed more than 700,000 summaries. This how you know that you are buying the best documents.

Quick and easy check-out

Quick and easy check-out

You can quickly pay through credit card or Stuvia-credit for the summaries. There is no membership needed.

Focus on what matters

Focus on what matters

Your fellow students write the study notes themselves, which is why the documents are always reliable and up-to-date. This ensures you quickly get to the core!

Frequently asked questions

What do I get when I buy this document?

You get a PDF, available immediately after your purchase. The purchased document is accessible anytime, anywhere and indefinitely through your profile.

Satisfaction guarantee: how does it work?

Our satisfaction guarantee ensures that you always find a study document that suits you well. You fill out a form, and our customer service team takes care of the rest.

Who am I buying these notes from?

Stuvia is a marketplace, so you are not buying this document from us, but from seller Classroom. Stuvia facilitates payment to the seller.

Will I be stuck with a subscription?

No, you only buy these notes for $14.49. You're not tied to anything after your purchase.

Can Stuvia be trusted?

4.6 stars on Google & Trustpilot (+1000 reviews)

76462 documents were sold in the last 30 days

Founded in 2010, the go-to place to buy study notes for 14 years now

Start selling
$14.49
  • (0)
  Add to cart