100% satisfaction guarantee Immediately available after payment Both online and in PDF No strings attached
logo-home
Summary Statistics 2 $5.43
Add to cart

Summary

Summary Statistics 2

 58 views  6 purchases
  • Course
  • Institution

This summary covers a recapitulation of Statistics 1 and covers the whole course of Statistics 2. Besides explanation of the topics, this summary also contains examples of statistical experiments and dives deep into explaining data interpretation. The statistical jargon/terminology needed to under...

[Show more]
Last document update: 2 year ago

Preview 3 out of 33  pages

  • May 16, 2022
  • June 21, 2022
  • 33
  • 2021/2022
  • Summary
avatar-seller
Statistics

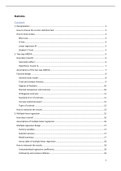
Content
1. Recapitulation ..................................................................................................................................... 3
How to choose the correct statistical test: ......................................................................................... 3
How to look at data: ............................................................................................................................ 4
Effect size......................................................................................................................................... 4
X² test .............................................................................................................................................. 4
Linear regression R² ......................................................................................................................... 5
Student’s T-test ............................................................................................................................... 5
2. Two-way ANOVA ................................................................................................................................. 6
How does it work? ............................................................................................................................... 6
Interaction effect ............................................................................................................................. 6
Hypothesis: H0 and Ha ...................................................................................................................... 7
Assumptions of the two-way ANOVA.................................................................................................. 7
Factorial design ................................................................................................................................... 8
General linear model: ...................................................................................................................... 8
Total and residual Variance ............................................................................................................. 9
Degrees of freedom....................................................................................................................... 10
Planned comparison and contrasts ............................................................................................... 10
Orthogonal contrasts..................................................................................................................... 11
Standard error of contrasts ........................................................................................................... 11
Increase statistical power .............................................................................................................. 12
Types of contrast ........................................................................................................................... 12
How to interpret the results.............................................................................................................. 13
3. Multiple linear regression ................................................................................................................. 15
How does it work? ............................................................................................................................. 16
Assumptions of multiple linear regression........................................................................................ 16
Multiple regression design ................................................................................................................ 17
Dummy variables ........................................................................................................................... 17
Selection process ........................................................................................................................... 17
Model summary ............................................................................................................................ 17
Anova table of multiple linear regression ..................................................................................... 18
How to interpret the results.............................................................................................................. 18
Unstandardized regression coefficients ........................................................................................ 18
Collinearity and variance inflation................................................................................................. 19


1

, Stepwise regression: entering predictors...................................................................................... 19
Backward elemination ................................................................................................................... 21
Forward selection .......................................................................................................................... 21
4. Power analysis and sample size determination ................................................................................ 21
B.E.A.N.S ............................................................................................................................................ 21
β, Type-2 error probability ............................................................................................................ 22
Effect size....................................................................................................................................... 22
α significance level, type-1 error ................................................................................................... 23
n; sample size ................................................................................................................................ 24
S, Standard deviation, variability, σ............................................................................................... 24
Increasing statistical power ............................................................................................................... 24
5. Bayesian inference ............................................................................................................................ 25
Null hypothesis testing ...................................................................................................................... 25
Bayesian hypothesis testing .............................................................................................................. 25
Priors in Bayesian analysis ................................................................................................................. 26
How to interpreted the results.......................................................................................................... 27
Bayes factor ................................................................................................................................... 27
Using a priori belief ....................................................................................................................... 27
Beta distribution 𝐵(𝛼, 𝛽) ............................................................................................................... 29
6. Meta-analysis .................................................................................................................................... 30
Funnel plots ....................................................................................................................................... 30
Forest plots ........................................................................................................................................ 31
Heterogeneity.................................................................................................................................... 32
Meta-analysis in steps ....................................................................................................................... 33


2

, 1. Recapitulation
How to choose the correct statistical test:


The independent variable is the cause. Its value is independent of other variables in your study.
The dependent variable is the effect. Its value depends on changes in the independent variable.

Qualitative research is expressed in words. It is used to understand concepts, thoughts or
experiences. This type of research enables you to gather in-depth insights on topics that are not well
understood.

Nominal data is labelled into mutually exclusive categories within a variable. These
categories cannot be ordered in a meaningful way. Like way of transport: bus, train, bike, car.

Ordinal data is classified into categories within a variable that have a natural rank order.
However, the distances between the categories are uneven or unknown. For example, the
variable “frequency of physical exercise” can be categorized into the following:

1. Never 2. Rarely 3. Sometimes 4. Often 5. Always


Quantitative research is expressed in numbers and graphs. It is used to test or confirm theories and
assumptions. This type of research can be used to establish generalizable facts about a topic.

Discrete variables represent counts (e.g. the number of objects you count in a variable).

Continuous variables represent measurable amounts (e.g. water volume or weight)


3

The benefits of buying summaries with Stuvia:

Guaranteed quality through customer reviews

Guaranteed quality through customer reviews

Stuvia customers have reviewed more than 700,000 summaries. This how you know that you are buying the best documents.

Quick and easy check-out

Quick and easy check-out

You can quickly pay through credit card or Stuvia-credit for the summaries. There is no membership needed.

Focus on what matters

Focus on what matters

Your fellow students write the study notes themselves, which is why the documents are always reliable and up-to-date. This ensures you quickly get to the core!

Frequently asked questions

What do I get when I buy this document?

You get a PDF, available immediately after your purchase. The purchased document is accessible anytime, anywhere and indefinitely through your profile.

Satisfaction guarantee: how does it work?

Our satisfaction guarantee ensures that you always find a study document that suits you well. You fill out a form, and our customer service team takes care of the rest.

Who am I buying these notes from?

Stuvia is a marketplace, so you are not buying this document from us, but from seller StephSilentium. Stuvia facilitates payment to the seller.

Will I be stuck with a subscription?

No, you only buy these notes for $5.43. You're not tied to anything after your purchase.

Can Stuvia be trusted?

4.6 stars on Google & Trustpilot (+1000 reviews)

51036 documents were sold in the last 30 days

Founded in 2010, the go-to place to buy study notes for 15 years now

Start selling
$5.43  6x  sold
  • (0)
Add to cart
Added