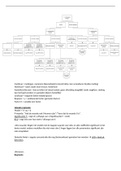
Continue = metingen, nummers (bijvoorbeeld concentraties, kan veranderen bij elke meting)
Nominaal = naam (zoals man/vrouw, hond/kat)
Aantallen/discreet = kun je tellen (of totaal aantal, geen afronding mogelijk) (zoals oogkleur, meting
kan herhaalt worden en aantallen blijven hetzelfde)
(ordinaal = volgorde (klein/middel/groot)
Respons = y = verklarende factor (gemeten factor)
Factor X = variable een factor
Lineaire regressie
Model = Yi= axi + b
P-waarde: ‘’had de waarde ook 0 kunnen zijn’’/‘’kans dat de waarde 0 is’’.
Significantie F = zegt of y afhangt van x (Significantie F < 0,05)
R^2 = zegt iets over hoe sterk Y afhangt van X
AICc/waarde: Regel, het model met de laagste waarde voor AICc en alle coëfficiënt significant is het
beste model; andere modellen die niet meer dan 2 hoger liggen (en alle parameters significant zijn
ook acceptabel.
Detectie limiet = aagste concentratie die nog (betrouwbaar) gemeten kan worden LOD = limit of
detection.
Uitvoeren:
Regressie
, Calabratie analyse: (Kiezen van juiste model):
In excel bestand, beste model heeft alle parameters significant + laagste Delta.c en laagste AIC.c!
Uitbijters:
Ook excel bestand: residuals (kijkt R = studentized) -2 of +2 = uitschieter!
Interpolatie:
x.0 is je geïnterpoleerde
* R^2 en R^2_adj zegt iets over effect sterkte!(praktische significantie)
standaard additie:
Lower/upper CI zijn je 95% BI
t-toets:
t = (X.E – mu) / S (y/x)
t.krit = t.inv.2t(0,1;n-P)
P = paramters
N = aantal
T > t.krit = significant verschil
T < t.krit = GEEN significant verschil
Detectie limiet: kleinste concentratie die nog bepaald kan worden
(ylod is ook wel Y.1, hiermee X.0 berekenen bij model 1.a bv, voor detectie limiet!)
Vergelijken van 2 methode
Model 2!
Invullen bij expeted parameters:
alpha.0 = 0
a.1 = 1
a.2 = 0
kijken naar hotelling T^2-test = p-waarde
indien:
P > 0,05 = paramets zijn significant
P < 0,05 = parameters zijn NIET significant en mogen uit het model
Voor multi regressie = via excel
Gegens gegevensanalyse regressie input range X en Y selecteren (inc labels,) klik aan:
labels + betrouwbaarheid 95%


