100% satisfaction guarantee Immediately available after payment Both online and in PDF No strings attached
logo-home
Summary Cheat sheet for SPSS MVDA $8.49
Add to cart

Summary

Summary Cheat sheet for SPSS MVDA

 107 views  3 purchases
  • Course
  • Institution

This document contains all weeks of the MVDA SPSS course. It features questions, steps to take to answer the questions, in which table to find the answer, and how to formulate your answer.

Last document update: 2 year ago

Preview 2 out of 9  pages

  • June 15, 2022
  • June 19, 2022
  • 9
  • 2021/2022
  • Summary
avatar-seller
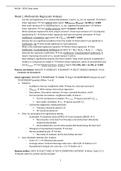
MVDA – SPSS Cheat sheet


Week 1, Multivariate Regression Analysis
- Can the null hypothesis of no relationship between Y and X1, X2, etc. be rejected? → Perform
linear regression → From ANOVA table report: F(dfregression, dfresidual) = 12.345, p = 0.003
- How much variance of Y is explained by X1, X2, etc. together/the predictors? → Perform
linear regression → From model summary report: R square = 0.123
- Which predictor explains the most unique variance? / How much variance of Y is (uniquely)
explained by X1? → Perform linear regression with part and partial correlation → From
coefficients, correlations, part report: X1: 𝒓𝟐𝒀(𝟏∙𝟐) = (0.123)2 = 0.015
- Remove the non-significant predictors from the model → Check which X are significant in
Coefficients, Sig → Only include significant in next regression.
- What is the estimated regression equation → Perform linear regression → From
Coefficients, Unstandardized Coefficients, B report: 𝒚 ̂ = 𝒃𝟎 + 𝒃𝟏 𝒙𝟏 + 𝒃𝟐 𝒙𝟐 + ⋯ + 𝒃𝒑 𝒙𝒑
- Interpret the regression coefficients → From Coefficients, Unstandardized Coefficients, B
report: Improving one point on X1, would improve Y with b1
- Does adding X2 significantly improve the linear model? / How much variance is explained in
model 2 in comparison to model 1? → Perform linear regression, add X2 to second block and
2
tick 𝑅𝑐ℎ𝑎𝑛𝑔𝑒 → From Model Summary, model 2 report: Yes, F(df1, df2) = 12.345, p = 0.003

Pearson correlations: ANALYZE → CORRELATE → BIVARIATE → SELECT DESIRED VARIABLES → tick
PEARSON OR SPEARMAN

Linear regression: ANALYZE → REGRESSION → LINEAR → drag X TO INDEPENDENT (based on) and Y
TO DEPENDENT (predict) (Often: Y on X)
• Statistics:
- Confidence interval: Coefficients table → Slope b1, intercept (constant)
2
- 𝑅𝑐ℎ𝑎𝑛𝑔𝑒 → When doing a hierarchical regression
- Descriptives: Descriptive statistics → mean, standard deviation, and N
- Part and partial correlations: Coefficients table → look at …
2
▪ Part for semipartial correlation → 𝑟𝑌(1∙2) → Square yourself: 𝑟𝑌(1∙2)
2
▪ Zero-order correlation → 𝑟𝑌1 → Square yourself: 𝑟𝑌1
- Collinearity diagnostics: Multicollinearity
▪ Tolerance should be above 0.10
▪ VIF should be below 10
• Plots: for assumptions for significance testing
- Scatterplot → predicted values (ZPRED → X) and residuals (ZRESID → Y)
▪ Non-linearity: Is the best fit of the data a horizontal line? (Should be
randomly distributed)
▪ Homoscedasticity: Are the dots equally distributed along the best line?
- Histogram of standardized residuals → Tick box
- Normal probability plot → Tick box
▪ Normality of residuals: do the dots follow the line?
• Save: Residuals Statistics (for outliers)
- Cook’s D < 1 → Influential data points
- Leverage values: Centered leverage value max < 3(K+1)/N → Outliers on X
- Standardized residuals min and max < |3| → Outliers on Y

Remove outliers: DATA → SELECT CASES → TICK IF CONDITION IS SATISFIED → Write: Cook’s D < 1
→ Results with this number will be excluded

1

, MVDA – SPSS Cheat sheet


Week 2, Analysis Of Variance
- What is sample size N, what are the group sizes, is the design balanced? → Perform Cross
Tabulation → From Case Processing Summary report: N = 50, From Crosstabulation report:
n1 = 15, n2 = 15, etc., From Crosstabulation report: Balanced if n1 = n2 = ni etc.
- Is the ANOVA F-test robust to violations of group normality → Perform Cross Tabulation →
from Crosstabulation report: n > 15: F is robust to non-normality
- Is the ANOVA F-test robust to violations of homogeneity of the group variances → Perform
Cross Tabulation → from Crosstabulation report: nmax / nmin = …/… = … < 1.5: F robust to …
- Check the assumption of normality by inspecting graphically the distribution of the
standardized residuals → Make a histogram with std. residuals on the X-axis → From Simple
Histogram of Standardized Residual for X, Report whether it is normally distributed. / Make
a Q-Q plot with standardized residuals → From Normal Q-Q Plot of Standardized Residual for
X, Report whether the variables are approx. similar to the line.
- Can the null hypothesis of equal group variances be rejected? Does the rule of thumb with
group standard deviations agrees with your first conclusion? → Perform ANOVA,
homogeneity tests and descriptive statistics → From Levene’s Test of Equality of Error
Variances, Based on Mean, report: Yes, Levene’s test is not significant: F (df1, df2) = 1.234,
p = 0.123. / From Descriptive Statistics, report: Yes, if sdmax / sdmin < 2
- Can the null hypothesis of no relationship between Y and X1 and/or X2 be rejected? (Is our
model good?) → Perform ANOVA → From Tests of Between Subject Effects, Corrected
Model report: Yes/no, F (dfmodel, dferror) = 12.345, p = 0.002
- Is effect of X1 or interaction effect significant? → Perform ANOVA → From Tests of Between
Subject Effects, Effect report: Yes/no, F(dfx1, dferror) = 12.345, p = 0.003 (So there is an effect)
- Which group has the highest estimated marginal mean (2 grp.)? → Perform ANOVA → From
Estimated Marignal Means, X1 report: Group 1 (Mean) has a higher Y than Group 2 (Mean)
- Which group has the highest estimated marginal mean? (3+ group)? → Perform ANOVA →
From Post Hoc Tests, Multiple Comparisons, report: Group A significantly higher than other
two groups (A negative Mean difference → group J higher than I).
- Interpret the interaction effect → Perform ANOVA → From Estimated Marginal Means and
Profile Plot report: Group A higher in condition I, group B reverse effect. No difference
between group A and B in condition II. (The effect of X1 can be changed by the effect of X2)
- How much variance in Y is explained by X1 → Perform ANOVA → From Tests of Between-
Subjects Effects, report: η2 = SSEffect ÷ SSTCorrected (0.01, 0.06, 0.14)

Cross tabulation: Analyze → Descriptive Statistics → Crosstabs → One variable Rows, one Columns

ANOVA: Analyze → General Linear Model → Univariate → Drag independent variables to Fixed
Factors, drag dependent variable to Dependent Variable
• Plots: Drag variable with most groups to Horizontal Axis, the other one to Separate Lines →
Click Add → Optional: Add variables the other way around.
• Options: Descriptive statistics and Homogeneity tests (Levene’s test)
• EM Means: Drag all the effects you want to Display Estimated Marginal Means for
• Save: Will make a new variable for Standardized residuals
• Post Hoc → Drag X1 to Post Hoc Tests For → Tick Tukey

Make a histogram: GRAPHS → CHART BUILDER → HISTOGRAM → Drag variable to X-AXIS

Make a Q-Q plot: ANALYZE → DESCRIPTIVE STATISTICS → Q-Q PLOTS → Move standardized
residuals to VARIABLES → Click OK

2

The benefits of buying summaries with Stuvia:

Guaranteed quality through customer reviews

Guaranteed quality through customer reviews

Stuvia customers have reviewed more than 700,000 summaries. This how you know that you are buying the best documents.

Quick and easy check-out

Quick and easy check-out

You can quickly pay through credit card or Stuvia-credit for the summaries. There is no membership needed.

Focus on what matters

Focus on what matters

Your fellow students write the study notes themselves, which is why the documents are always reliable and up-to-date. This ensures you quickly get to the core!

Frequently asked questions

What do I get when I buy this document?

You get a PDF, available immediately after your purchase. The purchased document is accessible anytime, anywhere and indefinitely through your profile.

Satisfaction guarantee: how does it work?

Our satisfaction guarantee ensures that you always find a study document that suits you well. You fill out a form, and our customer service team takes care of the rest.

Who am I buying these notes from?

Stuvia is a marketplace, so you are not buying this document from us, but from seller ShanavV. Stuvia facilitates payment to the seller.

Will I be stuck with a subscription?

No, you only buy these notes for $8.49. You're not tied to anything after your purchase.

Can Stuvia be trusted?

4.6 stars on Google & Trustpilot (+1000 reviews)

50990 documents were sold in the last 30 days

Founded in 2010, the go-to place to buy study notes for 15 years now

Start selling
$8.49  3x  sold
  • (0)
Add to cart
Added