In this document you will find everything you need to know for the Statistics' part of this course.
Clear explanations of the different tests, when to use them, their assumptions, how to run them on SPSS and examples on how to report the results in APA style.
You do not need all the theory incl...
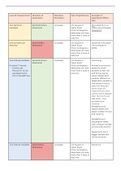
Level of measurement Direction of Statistical Test of Significance Strength of
Association Procedure Association/ Effect
Size
Two Nominal Symmetric/non- Crosstabs Chi-Square or Phi suited for 2 x 2
Variables directional Fisher Exact tables only otherwise
if the contingency Cramer’s V
table does not have
more than 2 rows or
columns
One (or both) are Asymmetric/ Crosstabs Chi-Square or Goodman & Kruskal's
Nominal Directional Fisher Exact Tau (Lambda on
if the contingency SPSS)
table does not have
more than 2 rows or
columns
Two Ordinal Variables Symmetric/non- Crosstabs Chi-Square or Gamma (y)
directional Fisher Exact
If ordinal * interval: if the contingency Kendall’s tau-b and c:
- Cannot use table does not have better for small
Pearson’s r so we more than 2 rows or samples (under 40)
use Spearman’s columns and for ties (same
rho or Kandall’s tau value independent
variable, different on
dependent variable or
vice versa (It means
data that have the
same value; for
instance,if you have
1,2,3,3,4 as the dataset
then the two 3's are
tied data.) + less
excitable than
Gamma
Kendall’s tau-b:
square tables with
equal number of rows
and columns
Kendall’s tau-c:
rectangular tables
with unequal number
of rows and columns
Spearman’s rho: if
bigger sample but
not so common
Two Ordinal Variables Asymmetric/ Crosstabs Chi-Square or Somer’s d
Directional Fisher Exact
if the contingency
table does not have
more than 2 rows or
columns
,Two continuous Symmetric/non- Bivariate // Pearson’s R
variable directional
One Continuous // Compare T-test Cohen’s d
Dependent Variable + Means, t-test Null hypothesis
One Independent tested: two group
Categorical variable -Independent means are not
with two groups sample t-test different
-Dependent
(paired) sample
t-test
-One sample t-
test
One Continuous // One-Way F-test Eta Squared
Dependent Variable + Anova Null hypothesis:
One Independent “the groups have
Categorical variable equal populations
with more than two means” or in test
groups statistic terms “The
between-groups
variance equals (or:
does not exceed)
the within- groups
variance in the
population”
One Continuous // Correlation, F-test Pearson’s r: the
Dependent Variable + Regression Null Hypothesis: correlation coefficient
One Continuous (simple “The F-test tests the – It gives you the
Independent regression null hypothesis that strength and the
analysis) the regression direction of a
model does not relationship
explain any
variance in XX in In simple regression,
the population” or R is equivalent to
“R^2 is 0 (zero) in Pearson’s R
the population”
Standardised Beta (in
APA style: b*)
One Continuous // Multiway Anova F-test Eta Squared
Dependent Variable + / factorial Null hypothesis: The
Two or more Anova F-test for the
Categorical interaction effect
Independent tests the null
Variables hypothesis that the
means of all
subgroups are
equal in the
population.
One Continuous // Correlation, F-test Standardised Beta (in
Dependent Variable + Regression “The F-test tests the APA style: b*)
Two or more (Multiple null hypothesis that
Continuous regression the regression
Independent analysis) model does not
Variables explain any
,Or both continuous variance in XX in
and categorical the population” or
variables -> multiple “R^2 is 0 (zero) in
regression with the population”
dummy
SPSS tips:
- Always paste all commands to the syntax before you run them, though
without unnecessary repetition (do not paste a single unique command
more than once) and in chronological order. Above each command that
you paste, add a caption that summarises the command, starting with an
asterisk (*) and ending with a full stop (.), so that the caption (and nothing
but the caption) appears in grey.
- If for a variable, values says “none” you need to add values if you are going
to use that variable, if you are not going to use it, you can leave “none”
- Steps in SPSS:
- Check your data and add as missing any wrong data
- Identify the independent and dependent variable
- Check the measurement levels of your variables and adjust if
needed
- Run the appropriate test
Which test to use:
- Check the level of measurements of your dependent and independent
variable will tell you which test is suitable
- Predict/prediction: usually regression analysis as it is what is does
1. We try to predict one variable from another variable
- Group difference:
1. two groups and two groups means: t-test
2. more than two groups: Anova test
Reporting:
- Percentages: one decimal; p-values three decimals; any other: two
decimals
- Check the italic (P, sd, t, f)
- When a p value is below .001, report it in the following manner: p < .001.
, Z-Score - Normal Distribution
- z-score (also called a standard score) gives you an idea of how far from the
mean a data point is. But more technically it’s a measure of how many
standard deviations below or above the population mean a raw score is.
- You need to know the mean and the population/sample standard
deviation
A z-score table shows the percentage of values (usually a decimal figure) to the
left of a given z-score on a standard normal distribution.
For example, imagine our Z-score value is 1.09.
The corresponding area is 0.8621 which translates into 86.21% of the standard
normal distribution being below (or to the left) of the z-score.
To find the area to the right of a positive z-score, begin by reading off the area in
the standard normal distribution table.
Since the total area under the bell curve is 1 (as a decimal value which is
equivalent to 100%), we subtract the area from the table from 1.
For example, the area to the left of z = 1.09 is given in the table as .8621. Thus the
area to the right of z = 1.09 is 1 - .8621. = .1379.
Steps:
- You have a data score, the mean and the standard deviation
- From there you calculate the z score
The benefits of buying summaries with Stuvia:
Guaranteed quality through customer reviews
Stuvia customers have reviewed more than 700,000 summaries. This how you know that you are buying the best documents.
Quick and easy check-out
You can quickly pay through credit card or Stuvia-credit for the summaries. There is no membership needed.
Focus on what matters
Your fellow students write the study notes themselves, which is why the documents are always reliable and up-to-date. This ensures you quickly get to the core!
Frequently asked questions
What do I get when I buy this document?
You get a PDF, available immediately after your purchase. The purchased document is accessible anytime, anywhere and indefinitely through your profile.
Satisfaction guarantee: how does it work?
Our satisfaction guarantee ensures that you always find a study document that suits you well. You fill out a form, and our customer service team takes care of the rest.
Who am I buying these notes from?
Stuvia is a marketplace, so you are not buying this document from us, but from seller sraxxx. Stuvia facilitates payment to the seller.
Will I be stuck with a subscription?
No, you only buy these notes for $21.77. You're not tied to anything after your purchase.