100% satisfaction guarantee Immediately available after payment Both online and in PDF No strings attached
logo-home
Summary CIMA BA1 Notes $7.73   Add to cart

Summary

Summary CIMA BA1 Notes

1 review
 150 views  5 purchases
  • Course
  • Institution

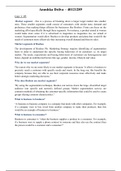
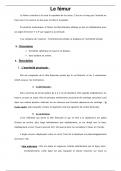
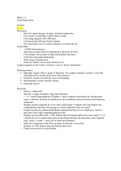
- Everything you need to pass BA1 - Detailed 55 pages of notes, complete with diagrams, graphs and formulae - My score: 95%

Preview 7 out of 55  pages

  • July 14, 2022
  • 55
  • 2021/2022
  • Summary

1  review

review-writer-avatar

By: jamesghanbouri • 1 year ago

avatar-seller
Chartered Institute of Management Accountants Certificate Level BA1

BA1 Fundamentals of Business Economics
Microeconomic and Organisational Context I: The Goals and Decisions
of Organisations
THE NATURE OF ORGANISATIONS
What is an organisation?
• There are many different definitions. The definition relevant to business: “organisations are social
arrangements for the controlled performance of collective goals”
• Social arrangements: Organisations have structure to enable people to work together;
whereas someone on their own does not constitute an organisation.
• Controlled performance: Organisations have procedures to ensure goals are achieved.
• Collective goals: Organisations are defined primarily by their goals.
• There is no widely accepted definition of organisations as it can be used broadly in two ways:
• To refer to a group/institution arranged for efficient work.
• To refer to a process, like a structuring of activity of the enterprise to achieve objectives.

Why do we need organisations?
• Organisations enable people to share skills and knowledge; to specialise; and to pool resources.
• This synergy of individuals enables organisations to achieve more than the individuals would on
their own.

Classifying organisations by profit orientation
• There are many different types of organisation, set up to serve different purposes, but their
commonalities are summarised in the overall definition.

• Profit-seeking organisations: view their main objective as maximising the wealth of their
owners/shareholders, and this objective is usually expanded into:
• Continue existence/survival
• Maintain growth and development
• Make a profit

• Not-for-profit organisations (NFPs): do not see profitability as their main objective and are
unlikely to primary focus on financial objectives; they instead seek to satisfy the needs of their
members/sectors of society. However these needs - and thus the objectives of such
organisations - can vary massively.
• Hospitals treat patients
• Charities provide relief to disaster victims
• Councils care for their communities
• NFPs must stay within their budgets however stakeholders are interested in how the organisation
contributes to their chosen field, leading to tensions between financial constraints and the NFP
organisation’s objectives. Many NFPs regard finances as a constraint under which they must
operate rather than an objective.
• Hospitals treat patients as best they can, subject to budget restrictions.
• Charities provide relief subject to funds raised.
• Councils care for their communities while trying to achieve value for money with council tax.

• Mutual organisations: a specific type of voluntary NFP formed to raise funds from its members
with which services can then be provided to those members, ie: building societies, co-operatives.
• Mutual organisations are therefore owned by employees, customers or members.
• Profit seeking bank vs Mutual NFP building society example:
• Building society: exists for the benefit of members, not to make a profit. Thus low interest rate
for borrowing and high interest rate for saving.
• Bank: exists to maximise shareholder wealth and create profit. Thus high interest rate for
borrowing and low interest rate for saving.

Classifying organisations by ownership/control
• Public sector: the part of the economy concerned with providing government services and is
thus owned/controlled by central or local government organisations.
• Private sector: comprising non-government organisations, both profit-seeking and NFP. Owned
by individuals, partners or shareholders.
Jack Gould 1 of 55

,Chartered Institute of Management Accountants Certificate Level BA1

SHAREHOLDER WEALTH
Maximising shareholder wealth
• Companies have the primary objective of maximising shareholder wealth, and this is ultimately
reflected in higher share prices and higher dividend payments.
• Managers in a business function to make decisions that affect the value of the company and
therefore the value of shareholder wealth. These decisions/considerations focus on 3 key issues:
• Cash preferable to profit: cash flow has higher correlation with shareholder wealth than profit.
• Net cash flows and profits are not the same; cash is more important to investors because
their returns are received either as dividends (cash) or in the form of a capital gain from a rise
in share price (the potential to earn cash by selling shoes).
• Moreover, profit does not necessarily mean shareholder wealth has increased to a level the
shareholder is satisfied with.
• Exceeding the cost of capital: cost of capital represents the required return by investors; or
the cost to the company of providing appropriate returns to investors. The return on capital
must be sufficient to cover the cost of all long-term finance, both equity and debt. Earnings
made beyond cost of capital will lead to growth in business value.
• Managing long and short term perspectives: stock market places a value on the company’
future potential, not just current profit levels; as investors increasingly evaluate this.

Short-term measures of financial performance
pr o f i t b e f or e i n t e r es t a n d t a x
• Return on capital employed (ROCE) = a v e r a ge c a p i t a l e m pl o y e d
x 100%

• ROCE gives an indication as to how well a business uses its capital to generate profit; or
rather, ROCE represents the productivity of capital and the ability of the company to generate a
flow of potential dividends to shareholders.
• ROCE is a percentage, thus is a useful metric to compare between companies.
• In the short run, companies will attempt to improve shareholder wealth by maximising
ROCE; the higher the figure the more profitable a firm is.
• However, ROCE is only a measure of net income generated by the business, and is not
concerned with where income goes.
• Another similar measure is return on net assets (RONA), however shareholders are more
interest in profits after tax and interest:
o p e r a t i n g pr o f i t (b e f or e i n t e r es t a n d t a x)
• Return on net assets (RONA) = t o t a l a ss e t s m i n u s c u r r e n t l i a b i l i t i es
x 100%

pr o f i t a f t e r i n t e r es t, t a x a n d pr e f e r e n c e sh a r e d i v i d e n d s
• Earnings per share (EPS) = n u m b e r o f or d i n a r y sh a r es i ss u es
x 100%

• Figures called ‘profit after tax’ include interest paid deductions unless stated otherwise
• EPS is profit available to ordinary shareholders per share; however the rate of return to the
shareholder must take into consideration the price paid to acquire a share.
• EPS can be raised by buying back shares, investing in profitable projects or reducing tax paid
• The key weaknesses of ROCE and EPS are that they do not directly correlate to the goal of
maximising shareholder wealth.

Long-term measures of financial performance
• Important that a business can be sure that returns to shareholders are at least equal to the cost
of acquiring the capital required to produce a long term flow of earnings. Several problems arise:
• Establishing the cost of capital to finance the investment project
• Estimating the flow of income derived from the capital investment
• Valuing that flow of income
• To solve these issues we calculate the present value of future cash flows by a process of
discounting (see page 44)

Share values
• Concept of discounted cash flows can be used to explain how press releases and market
rumours can affect share prices.
• If the market believes a company’s new project will deliver a positive net present value (NPV),
then the share price should rise; any suggestion that future cash flows will be higher should

Jack Gould 2 of 55

,Chartered Institute of Management Accountants Certificate Level BA1

result in a share price rise. In the long run, the main technique used to measure increase
in shareholder value is net present value NPV using discounted cash flows.
• Alternatively, if the news is bad and cash flow is forecasted downwards, investors may regard
investing as higher risk, ultimately resulting in a fall in share price.
• Many variables affect share value:
• External factors to the business: onset of recession, rise in interest rates.
• Internal factors to the business: failure of a new product, expected sales decline, rise in costs.

STAKEHOLDERS
• “Those persons and organisations that have an interest in the strategy of an organisation”.
• Important that an organisation understands the varying needs of different stakeholders, who
have an interest and an influence its objectives and strategy, to varying extents.
• Stakeholder interest: interest a stakeholder has in an organisation’s actions, objectives or policy
• Stakeholder influence: level of involvement a stakeholder has in the organisation and the ability
to bring about a desired change.
• Degree of interest and influence of stakeholders can vary considerably:
• A well organised labour force with a strong trade union ay exercise considerable influence over
directors’ plans, and may be interested in working conditions and staff welfare.
• Residents of a small village may be very interested in plans for a new supermarket next to a
village store, but hold little influence over decisions.

Internal stakeholders
• Closely connected to the organisation, their objectives likely strongly influence how it is run:
• Employees: expect pay, working conditions and job security.
• Managers/directors: expect status, pay, bonus, job security.

Connected stakeholders
• Contractual relationships with the organisation; objective of satisfying shareholders as prime
objective which the management of the organisation must fulfil:
• Shareholders: want steady flow of income, possible capital growth and business continuation.
• Customers: expect needs to be satisfied through value-for-money products and services.
• Suppliers: expect prompt payment.
• Finance providers: expect ability to repay finance including interest, and investment security.

External stakeholders
• Diverse objectives and a varying influence/ability to ensure the organisation meets their needs:
• Community: lives impacted by organisation’s decisions.
• Environmental ressure groups.
• Government: company activity key to economic success, and expect legislation to be obeyed.
• Trade unions: take an active part in decision-making process.

STAKEHOLDER CONFLICT
• Needs and expectations of different stakeholders may conflict, with solutions requiring
compromise and prioritisation:
• Employees vs managers/directors: jobs/wages vs bonus
• Customers vs shareholders: product quality vs profits/dividends
• Community vs shareholders: environmental impact vs profits/dividends
• Managers vs shareholders: revenue growth vs profit growth
• To resolve stakeholder conflict, firms will assess the degree of a stakeholder’s interest, and their
respective influence on the business. While one stakeholder’s objectives might take preference,
(ie maximising shareholder value for a company) this does not mean others are ignored.
• Some firms might see shareholder wealth generation as their primary objective and the needs
of other stakeholders and the constraints within which they must operate.
• Not-for-profit organisation (NFP) stakeholder conflict:
• NFPs may not have one dominant stakeholder, thus must satisfy several at once, without the
touchstone of one primary objective. This is often difficult, as factors are hard to quantify.

MANAGEMENT OBJECTIVES
• Managers in a company take on the role of making decisions that ultimately lead to an increase
in shareholder wealth, by sourcing and investing in projects whose returns exceed the company’s

Jack Gould 3 of 55

,Chartered Institute of Management Accountants Certificate Level BA1

cost of capital. However, as different stakeholders, managers and shareholders may have
different objectives, giving rise to an important stakeholder conflict…

The principal - agent problem
• Companies on the stock market are often very large and complex, requiring a substantial
investment in equity to fund them, thereby having many shareholders. These shareholders
delegate control to managers (board of directors) to run the company on their behalf, while
playing a passive role in management of daily activities.
• This separation of ownership and control can lead to a conflict of interest between these two
stakeholders because the principals (shareholders, legal owner of the organisation) must find
ways to ensure the appointed agents (managers/directors) act in their interest.
• The managers and directors may act to achieve a set of objectives reflecting their own self-
interest - which may conflict with owners’ objectives of profitability/shareholder wealth - such as
power, status, prestige, renumeration and so on. How can the principal, as the business owner,
ensure the agent will act in a way to achieve their objectives?

Possible areas of conflict
• Mergers and acquisitions: most acquisitions erode shareholder value rather than create it,
maybe because directors seek to expand their sphere of influence rather than shareholder value.
• Lack of shareholder control: resulting in scandals; ‘the divorce of ownership from control’.
• Short-termism: managers may take decisions to maximise short term profitability to achieve
bonuses, at the expense of long term objectives:
• Sales maximisation: in some circumstances focusing on seas may sacrifice profitability.
• Growth maximisation: growth can occur at the expense of profitability.
• ‘Satisfying’: managers may want to do ‘just enough’ to achieve their targets, rather than strive
to maximise shareholder wealth
• ‘Fat cat’ salaries and benefits: directors paid huge bonuses despite making a loss. This may be
resolved by reviewing remuneration and bonus schemes given to directors, as high bonuses
linked to profit may encourage short-termism.

The objectives of corporate governance
• “The systems by which companies and other organisations are directed and controlled”.
• It is not a legal requirement for all companies; rather, it depends on the size of the company.
• A system used to direct, manage and monitor an organisation; improving the way companies are
governed and run, particularly addressing the principal-agent problem, amongst other issues:
• Control agents by increasing the amount of reporting and disclosure. Such as directors having
limited - and publicly disclosed - contracts.
• Increase confidence and transparency in company activities for investors (current and
potential), thus promoting growth. Such as an annual accounts statement approved by auditors
that the business is financially healthy.
• Ensure the company is run legally and ethically. Such as three sub-committees of the board:
audit, nominations (to oversee board appointments), remunerations (to determine director pay).
• Strengthening the control structure to increase accountability at the top that can cascade down.
Such as spreading board level responsibilities around, not concentrating them in a few hands.
• Improves credit rating: therefore improves access to capital markets
• UK Corporate Governance Code (2010): represents ‘best practice’ in corporate governance:
• Separation of powers; and board membership including an appropriate balance.
• Approach reflecting all stakeholder interests.
• Principles of transparency, openness, and fairness.
• Board of directors made fully accountable.
• Detailed disclosure and reporting.
• Board sub-committees

TRANSACTION COSTS
• A company has a choice for any economic activity: perform the activity in-house or go to market.
The cost of the activity in either case can be broken into production and transaction costs.
Managers face a choice between if performing the activity in-house or to outsource it will be a
better decision from a shareholder wealth perspective.
• Transaction costs occur when dealing with an external party (although these can be hard to
determine when outsourcing):

Jack Gould 4 of 55

,Chartered Institute of Management Accountants Certificate Level BA1

• Search and information costs: find suppliers
• Bargaining and decision costs: determine contracts
• Policing and enforcement costs: monitor quality
• It is in the interests of management to mostly internalise transactions, to remove these costs, and
to reduce risks and uncertainties regarding prices and quality.
• Variables dictating impact on transaction costs are frequency; uncertainty; and asset specificity.

When transaction costs change
• Changes in transaction costs call into question the need for traditional organisational forms and
for vertical integration, because if their costs reduce, then the cost of outsourcing will decrease
relative to undertaking the activity internally, making it more likely/viable; whereas if the business
is able to reduce its production costs then outsourcing becomes less likely/viable.


Jack Gould 5 of 55

,Chartered Institute of Management Accountants Certificate Level BA1

Microeconomic and Organisational Context II: The Market System
INTRODUCTION
Different market systems
• Resources are scarce (limited), so societies face the fundamental economic problem of deciding
what goods and services should be produced because it is not possible to satisfy everyone’s
wants (unlimited wants). This raises the questions of: what goods and services should be
produce? in what quantities? By who? For who? Three main systems to solve this:
• A market economy: interaction between supply and demand (market forces) to decide;
patterns of economic activity are determined by individual consumer and producer decisions.
• A command economy: production controlled by the government.
• A mixed economy: mix of free market and government intervention (modern economies).
• In a free market, the quantity and price of goods supplied are determined by the interaction
between supply and demand; this ‘invisible hand of the market’ sets the market (equilibrium)
price. (see diagram below)


Market economy is characterised by:

Allocation of resources by the price
mechanism
Prices determined by market forces
Private ownership of productive
resources


DEMAND
• Individual demand: shows how much of a good or service someone intends to buy at different
prices, assuming the conditions of demand are constant.
• Market demand: the aggregated amount of effective demand from all consumers in a market.
• When demand for a good or service changes in response to a change in its price, this is:
• An expansion in demand, when quantity rises due to a fall in price
• A contraction in demand when quantity falls due to a rise in price
• The relationship between demand and price is shown in a diagram and referred to as a demand
curve (x axis is quantity, y axis is price): for most normal goods this a negatively inclined straight-
line curve sloping downward from left to right.
• A movement along this curve is an expansion or contraction in demand.

Conditions of demand
• Any change in the conditions of demand will create shifts in the demand curve itself:
• If the shift in the demand curve is outward to the right, is an increase/rise in demand.
• If the shift in the demand curve is inward to the left, is a decrease/fall in demand.
• Main conditions of demand:
• Income: for example lower direct taxes would raise disposable incomes, making consumers
better off and thus spending more. For inferior goods however, a rise in income leads to a lower
demand for the product as customers are now richer and will substitute better quality and
preferred goods and services for the original.
• Tastes: in particular fashions, change frequently, and make demand for certain goods volatile.
Tastes can be manipulated by advertising and producers to try to ‘create’ market; whereas
demand for some goods will change seasonally as tastes change more naturally.
• Prices of other goods: some goods may be complements or substitutes to one another.
• Complements: if goods are in joint demand (cars and tyres for example), a change in price
of one will affect the other.
• Substitutes: if goods are substitutes (Coke and Pepsi for example), a rise in price of one will
cause an increase in demand of the other, and vice versa.
• Technological advancements: technological breakthroughs can mean the emergence of
new products in the market (music streaming services vs CDs) which affect demand.
• Population: increase in population creates a larger market for most goods, increasing
demand; changes in demographics will affect demand (such elderly demand for wheelchairs).

Jack Gould 6 of 55

, Chartered Institute of Management Accountants Certificate Level BA1

• If a price change occurs, there will be a movement along the demand curve, resulting in an
expansion or contraction in demand. (D1 in diagram)
• If the conditions of demand change, there will be a shift in the demand curve, resulting in an
increase or decrease in demand. (D2 in diagram)


ELASTICITY OF DEMAND
• Elasticity refers to the relationship between two variables and measures the responsiveness of
one dependent variable to a change in another independent variable.
• Price elasticity of demand can give a strong indication of the optimal price for a good or service.

Price elasticity of demand (PED)
• PED explains the relationship between changes in quantity demanded and changes in price; the
responsiveness of demand for a good to a change in its price. For normal goods, PED is always
negative because price and quantity are inversely related; they respond in a negative way to one
another.
p e r c e n t a ge ch a n ge i n q u a n t i t y d e m a n d e d
• The coefficient of PED is calculated by: p e r c e n t a ge ch a n ge i n pr i c e

• It is essential that percentage or proportional changes are used rather than absolute ones.
• Non-average arc method: uses the starting point of price and quantity as the basis for the %
calculation:
n e w d e m a n d − ol d d e m a n d
• Non-average percentage change in demand = ol d d e m a n d
x 100

n e w pr i c e − ol d pr i c e
• Non-average percentage change in price = ol d pr i c e
x 100

• Average arc method: uses the average price and quantity as the basis for the % calculation
n e w d e m a n d − ol d d e m a n d
• Average percentage change in demand = a v e r a ge o f n e w a n d ol d d e m a n d x 100
n e w pr i c e − ol d pr i c e
• Average percentage change in price = a v e r a ge o f n e w a n d ol d pr i c e x 100

Demand PED co- Description Example
curve e cient value
elasticity
D4
Perfectly 0 Demand completely No examples (air or water
inelastic (D4) insensitive to price if they could be controlled)

Relatively Between 0 and % change in demand Tea, salt
inelastic -1 smaller than %
(D2) change in price D5
Unit elasticity -1 % change in demand
(D1) = % change in price

Relatively Between -1 % change in demand Cameras, air travel
elastic and -∞ (minus is larger than %
(D3) infinity) change in price

Perfectly -∞ (minus Demand completely Foreign currency
elastic (D5) infinity) sensitive to price exchange

Jack Gould 7 of 55


ffi

The benefits of buying summaries with Stuvia:

Guaranteed quality through customer reviews

Guaranteed quality through customer reviews

Stuvia customers have reviewed more than 700,000 summaries. This how you know that you are buying the best documents.

Quick and easy check-out

Quick and easy check-out

You can quickly pay through credit card or Stuvia-credit for the summaries. There is no membership needed.

Focus on what matters

Focus on what matters

Your fellow students write the study notes themselves, which is why the documents are always reliable and up-to-date. This ensures you quickly get to the core!

Frequently asked questions

What do I get when I buy this document?

You get a PDF, available immediately after your purchase. The purchased document is accessible anytime, anywhere and indefinitely through your profile.

Satisfaction guarantee: how does it work?

Our satisfaction guarantee ensures that you always find a study document that suits you well. You fill out a form, and our customer service team takes care of the rest.

Who am I buying these notes from?

Stuvia is a marketplace, so you are not buying this document from us, but from seller jackg. Stuvia facilitates payment to the seller.

Will I be stuck with a subscription?

No, you only buy these notes for $7.73. You're not tied to anything after your purchase.

Can Stuvia be trusted?

4.6 stars on Google & Trustpilot (+1000 reviews)

67474 documents were sold in the last 30 days

Founded in 2010, the go-to place to buy study notes for 14 years now

Start selling
$7.73  5x  sold
  • (1)
  Add to cart