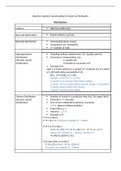
Business Statistics Samenvatting Formules en Methoden
Distributions
Uniform Allemaal zelfde kans
Bernoulli distribution Event is binary ( yes/no)
Binomial distribution Verzameling binary events
Parameters: pie: probability
n = number of trials
Hypergeometric Sampling without replacement. (I.E. Quality control)
Distribution Parameters: N=population size
(discrete valued n=sample size
distribution) s=number of successes in N
Example in R:
Spot 1 or fewer defects in a sample of 7 products out of a batch
of 1,000 with defect probability 0.05.
P(x<_1|N=1000,n=7,s=50)
=phyper (1,50,950,7) = 0.9562
1e getal= P op hoeveel witte ballen pakken
2e getal = hoeveel witte ballen/kapotte dingen in population
3e getal=zwarte ballen/hele dingen
4e getal= hoeveel ballen pakke
Poisson Distribution Number of events in a particular time slot ( No upper limit)
(discrete valued Parameter: λ = intensity
distribution) Sum of two independent poissons is poisson:
λ 1+ λ2 (gewoon labdas optellen)
Expectation μ: λ
Variance σ 2: λ
Example in R:
P of no orders?
P ( X=0|λ=5 )=¿ dpois(0, lambda=5) = 0.0067
P of 4 to 10 orders?
P ( 4 ≤ X ≤ 10|λ=5 )=P ( X ≤10| λ=5 )−P( X ≤ 3∨ λ=5)
=ppois (10, lambda=5) – ppois(3, lambda=5)
=0.9863-0.2650=0.7213
P of more than 12 orders?
P ( X >12|λ=5 )=1−P ( X ≤ 12|λ=5 )
= 1-ppois (12, lambda=5) = 0.0020
, Exponential distribution Waiting times, time until an event happens
(continuous random Parameter: λ
variable) Expected waiting time is 1/ λ
Expectation μ= 1/ λ
Variance σ 2=1/ λ2
Example in R:
Waiting times are exponentially distributed with intensity λ =0.1
What is the probability of having to wait more than 5 minutes?
P ( X >5 ) =1−P( X ≤ 5)
=1-pexp(5, rate=0.1)= 0.6065307
What is the probability of having to wait 6 to 11 minutes?
P ( 6< X <11 )=P ( X <11 )−P( X <6)
=pexp(11,rate=0.1) – pexp(6,rate=0.1)=0.2159406
What is the maximum waiting time with a 99% probability?
P ( X < x )=0.99 = qexp(0.99, rate= 0.1)= 46.0517
Chi-squared ( x 2 ¿ ¿ Waiting times as well
distribution More in testing and statistical sense
Parameter: DF(degrees of freedom) orn
Expectation μ=n
Variance σ 2=2 n
Example in R:
2
P( x ¿ ¿ 6 ≤2.31) ¿
Pchisq(2.31, df=6)=0.1109037
P ( x 6 ≤ x ) =0.90
2
Qchisq(0.90, df=6)=10.64464
F-distribution Used in testing and statistical sense
Parameter: DF1 (degrees of freedom)
DF2
Example in R:
P( F 5,2 ≤ 2.31)
Pf(2.31, df1=5, df2=2)= 0.6708211
P¿
Qf(0.90, df1=5, df2=2)= 9.292
Tekens
Population size N
Sample size n
Population Mean μ
Sample mean x́
Expected value E(X)
2
Population Variance σ
The benefits of buying summaries with Stuvia:
Guaranteed quality through customer reviews
Stuvia customers have reviewed more than 700,000 summaries. This how you know that you are buying the best documents.
Quick and easy check-out
You can quickly pay through credit card or Stuvia-credit for the summaries. There is no membership needed.
Focus on what matters
Your fellow students write the study notes themselves, which is why the documents are always reliable and up-to-date. This ensures you quickly get to the core!
Frequently asked questions
What do I get when I buy this document?
You get a PDF, available immediately after your purchase. The purchased document is accessible anytime, anywhere and indefinitely through your profile.
Satisfaction guarantee: how does it work?
Our satisfaction guarantee ensures that you always find a study document that suits you well. You fill out a form, and our customer service team takes care of the rest.
Who am I buying these notes from?
Stuvia is a marketplace, so you are not buying this document from us, but from seller BramHezemans. Stuvia facilitates payment to the seller.
Will I be stuck with a subscription?
No, you only buy these notes for $14.09. You're not tied to anything after your purchase.