100% satisfaction guarantee Immediately available after payment Both online and in PDF No strings attached
logo-home
Samenvatting Alle testen statistiek $6.97
Add to cart

Summary

Samenvatting Alle testen statistiek

 12 views  0 purchase
  • Course
  • Institution

In dit document zijn alle testen die je moet kennen tijdens het tentamen in duidelijke stappen uitgelegd. Als je dit document bij het open boek tentamen hebt zul je alle testen kunnen maken.

Preview 4 out of 76  pages

  • August 30, 2022
  • 76
  • 2021/2022
  • Summary
avatar-seller
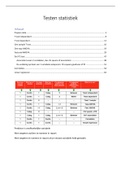
Testen statistiek
Inhoud
Prepare data ............................................................................................................................................ 3
T test independent .................................................................................................................................. 8
T test dependent ................................................................................................................................... 12
One sample T test.................................................................................................................................. 16
One way ANOVA .................................................................................................................................... 19
Factorial ANOVA .................................................................................................................................... 29
De X^2 test ............................................................................................................................................ 47
Associatie tussen 2 variabelen, dus chi square of association: ......................................................... 48
De verdeling op basis van 1 variabele analyseren: Chi-square goodness of fit ................................ 51
Correlaties ............................................................................................................................................. 54
Linear regression ................................................................................................................................... 62


Predictor is onafhankelijke variabele
Niet vergeten outliers te noemen in report
Niet vergeten te noemen in report als je nieuwe variabele hebt gemaakt

,
,Prepare data
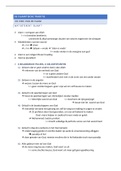
1. Check whether the dataset contains invalid scores
For example, items that have been measured on a 7-point Likert-scale cannot contain scores
of 8 or higher.
→ Remove invalid input/scores – NEVER remove outliers, only when truly invalid e.g. 6 kg
human weight.

2. Calculate a cut point if you need to create equal groups
1. Click ‘Analyze’ > ‘Descriptive Statistics’ > ‘Frequencies’
2. Put the variable in the box ‘Variables’
3. Click ‘Statistics’ and put a tick in ‘Cut points for …’ and specify with a number of groups
4. Click ‘Continue’ and ‘OK’

3. Check whether items for scales need recoding
Items for scales should either ALL measure a positive attitude or ALL measure a
negative attitude.
Recode
1. Click ‘transform’ > ‘Recode into different variable’
2. Put the variable you want to recode in the box ‘Numeric variables’
3. Change the name to ‘name_r’ and click ‘Change’
4. Click ‘Old and New Values’
5. Put in the ‘Old value’ the old number and in the ‘New value’ the new number (e.g. 1 = 5, 2
= 4, etc.)
6. Optional: Create groups with ‘Range’ or choose ‘All other values’. You can delete the rest
with ‘System-missing’
7. Click ‘Add’
8. Click ‘Continue’ and ‘OK’

4. Check the reliability of the scales
We want high inter item correlations to ensure construct (convergent) validity of the
measures.
Cronbach’s Alpha (α)
1. Click ‘Analyze’ > ‘Scale’ > ‘Reliability Analysis’
2. Move the items in the box ‘Items’ (take the recoded ones)
3. Click ‘Statistics’ and put a tick in ‘item’ + ‘scale’ + ‘scale if item deleted’
4. Click ‘Continue’ and ‘OK’
5. Perform again if you deleted an item

Voorbeeld:

, Chronbach’s alpha kan alle waarden aannemen tussen 0 en 1.
1 is perfect consistent, 0 is rotzooi.
Criterium: a >_ .65 is ok, lager niet
Dus is hier goed.

5. Compute the mean values
1. Click ‘Transform’ > ‘Compute variable’
2. Name the new variable by typing in the box ‘Target Variable’
3. Go to the box ‘Function group’ and select ‘Statistical’
4. Select in ‘Functions and Special Variables’ the function you want to use (e.g. mean)
5. Fill in the (...,...) with the variables you want to compute, use a comma to separate them
6. Optional: specify a minimum score by typing a dot and a number (e.g. MEAN.3) between
the function name and (
7. Click ‘OK’

6. Check if you need to split the file (e.g. gender) → only use for exploring
1. Click ‘Data’ > ‘Split file’
2. Click ‘Compare groups’
3. Place the variable you want to divide in the box ‘Groups based on’
4. Click ‘OK’
5. Perform your descriptives/explore analysis
6. Don’t forget to undo this before the next question by: doing the same but click ‘analyze all
cases’ in the split file menu


7. In je datafile heb je alleen de factoren, maar niet de condities
We lossen dit op door de 2 factoren ‘te fuseren’ in een nieuwe variabele: conditions.
Hier is hoe je dat doet

SPSS -> transform -> compute variable -> conditions -> 1 -> if -> image_type -> include if
cases satisfies condition = text_type = 1 & image_type = 1 -> continue

The benefits of buying summaries with Stuvia:

Guaranteed quality through customer reviews

Guaranteed quality through customer reviews

Stuvia customers have reviewed more than 700,000 summaries. This how you know that you are buying the best documents.

Quick and easy check-out

Quick and easy check-out

You can quickly pay through credit card or Stuvia-credit for the summaries. There is no membership needed.

Focus on what matters

Focus on what matters

Your fellow students write the study notes themselves, which is why the documents are always reliable and up-to-date. This ensures you quickly get to the core!

Frequently asked questions

What do I get when I buy this document?

You get a PDF, available immediately after your purchase. The purchased document is accessible anytime, anywhere and indefinitely through your profile.

Satisfaction guarantee: how does it work?

Our satisfaction guarantee ensures that you always find a study document that suits you well. You fill out a form, and our customer service team takes care of the rest.

Who am I buying these notes from?

Stuvia is a marketplace, so you are not buying this document from us, but from seller anoukdegroot1. Stuvia facilitates payment to the seller.

Will I be stuck with a subscription?

No, you only buy these notes for $6.97. You're not tied to anything after your purchase.

Can Stuvia be trusted?

4.6 stars on Google & Trustpilot (+1000 reviews)

53340 documents were sold in the last 30 days

Founded in 2010, the go-to place to buy study notes for 14 years now

Start selling
$6.97
  • (0)
Add to cart
Added