In this report I will be considering each ratio and would make an evaluation of the strength
and weakness of Mainwaring Engineering bearing in mind the statistics of last year and the
industry average. I will also provide the limitations of the ratio analysis and finalise my work
with a conclusion of my report.
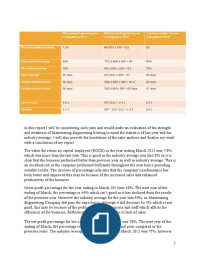
The value for return on capital employed (ROCE) in the year ending March 2011 was 7.8%
which was more than the last year. This is good as the industry average was also 8% so it is
clear that the business performed better than previous year as well as industry average. This is
an excellent job as the company performed brilliantly throughout the year hence providing
evitable results. The increase of percentage indicates that the company’s performance has
been better and improved this may be because of the increased sales and enhanced
productivity of the business.
Gross profit percentage for the year ending in March 2011was 48%. The next year of the
ending of March, the percentage is 44% which isn’t good as it has declined from the results
of the previous year. However the industry average for the year was 40%, so Mainwaring
Engineering Company did pass the expectancy, although it did decrease by 4% which is not
good, this may be because of the performance of the business and staff which affects the
efficiency of the business, furthermore this may also be due to lack of sales.
The net profit percentage for the year ending in March 2011 was 76%. The next year of the
ending of March, the percentage is 4.2% which is very bad and poor compared to the
previous years. The industry average for the year ending of March 2012 was 75%, however
1
, the company performed poorly and made a staggering 4.2% which is horrific as the
percentage declined rapidly. This may have been caused due to poor business performance, as
the business lacked customer service, decline in sales and some other factors why may have
disrupted the growth of the business and assisted the factors to such an extent that the
business performance was the worst it possibly ever could be.
For stock turnover, during the year ending March 2011 the stock turnover days is 92. The
next year of the ending of March, the stock turnover day is 95 which is better compared to the
previous year, and it has increased by 3 days which is important. The industry averaged the
year at 90 days, but it has surpassed that prediction and it came up with 95 days. This type of
results indicates that the performance of the business is good because if the stock turnover is
high then it means that the sale of stock is healthy, which is a very beneficial to the business.
The debtor collection period, during the year ending March 2011 the debtor collection period
is 58 days. The next year of the ending of March, the debtor collection period is 60.3 days
which comparatively poor as it has increased by 2 days. The industry average for the year is
55 days; however the business is going beyond that expectation which is not good. Hence it
means that the business is taking longer time to claim their money back from the people who
owe them money, this can be very harmful as some persons can take it easy and might even
take longer time to return a bigger amount in the future.
The creditor payment period, during the year ending in March 2011is 60 days. The next year
of the ending of March, the credit payment period is 262.3 days which is a very poor
performance because it has increased by 200 days over the one year period. The industry
average for the year was 57 days but the business is going beyond that forecast and that's not
good as the business have to pay more to its creditors. This means that the business owes
money to people or suppliers and 262.3 days is a lot of money that they need to pay off. This
will affect the business dramatically as they won’t be able to pay off as it would increase the
burden on the business. Hence if the suppliers are not paid in time or the time agreed then the
suppliers won’t supply the raw materials to the business. Then the business might have to
change their suppliers and maybe the new suppliers will provide the same products and
materials at an expensive rate that the business have to control, which will eventually
increase the price for their products and services.
Limitations of Ratio Analysis
Ratio analysis can be used to compare information taken from the financial statements to gain
a general understanding of the results, financial position, and cash flows of a business. This
analysis is a useful tool, especially for an outsider such as a credit analyst, lender, or stock
analyst. These people need to create a picture of the financial results and position of a
business just from its financial statements. Despite the usefulness there are some limitations
of ratio analysis as well:
Inflation
2
and weakness of Mainwaring Engineering bearing in mind the statistics of last year and the
industry average. I will also provide the limitations of the ratio analysis and finalise my work
with a conclusion of my report.
The value for return on capital employed (ROCE) in the year ending March 2011 was 7.8%
which was more than the last year. This is good as the industry average was also 8% so it is
clear that the business performed better than previous year as well as industry average. This is
an excellent job as the company performed brilliantly throughout the year hence providing
evitable results. The increase of percentage indicates that the company’s performance has
been better and improved this may be because of the increased sales and enhanced
productivity of the business.
Gross profit percentage for the year ending in March 2011was 48%. The next year of the
ending of March, the percentage is 44% which isn’t good as it has declined from the results
of the previous year. However the industry average for the year was 40%, so Mainwaring
Engineering Company did pass the expectancy, although it did decrease by 4% which is not
good, this may be because of the performance of the business and staff which affects the
efficiency of the business, furthermore this may also be due to lack of sales.
The net profit percentage for the year ending in March 2011 was 76%. The next year of the
ending of March, the percentage is 4.2% which is very bad and poor compared to the
previous years. The industry average for the year ending of March 2012 was 75%, however
1
, the company performed poorly and made a staggering 4.2% which is horrific as the
percentage declined rapidly. This may have been caused due to poor business performance, as
the business lacked customer service, decline in sales and some other factors why may have
disrupted the growth of the business and assisted the factors to such an extent that the
business performance was the worst it possibly ever could be.
For stock turnover, during the year ending March 2011 the stock turnover days is 92. The
next year of the ending of March, the stock turnover day is 95 which is better compared to the
previous year, and it has increased by 3 days which is important. The industry averaged the
year at 90 days, but it has surpassed that prediction and it came up with 95 days. This type of
results indicates that the performance of the business is good because if the stock turnover is
high then it means that the sale of stock is healthy, which is a very beneficial to the business.
The debtor collection period, during the year ending March 2011 the debtor collection period
is 58 days. The next year of the ending of March, the debtor collection period is 60.3 days
which comparatively poor as it has increased by 2 days. The industry average for the year is
55 days; however the business is going beyond that expectation which is not good. Hence it
means that the business is taking longer time to claim their money back from the people who
owe them money, this can be very harmful as some persons can take it easy and might even
take longer time to return a bigger amount in the future.
The creditor payment period, during the year ending in March 2011is 60 days. The next year
of the ending of March, the credit payment period is 262.3 days which is a very poor
performance because it has increased by 200 days over the one year period. The industry
average for the year was 57 days but the business is going beyond that forecast and that's not
good as the business have to pay more to its creditors. This means that the business owes
money to people or suppliers and 262.3 days is a lot of money that they need to pay off. This
will affect the business dramatically as they won’t be able to pay off as it would increase the
burden on the business. Hence if the suppliers are not paid in time or the time agreed then the
suppliers won’t supply the raw materials to the business. Then the business might have to
change their suppliers and maybe the new suppliers will provide the same products and
materials at an expensive rate that the business have to control, which will eventually
increase the price for their products and services.
Limitations of Ratio Analysis
Ratio analysis can be used to compare information taken from the financial statements to gain
a general understanding of the results, financial position, and cash flows of a business. This
analysis is a useful tool, especially for an outsider such as a credit analyst, lender, or stock
analyst. These people need to create a picture of the financial results and position of a
business just from its financial statements. Despite the usefulness there are some limitations
of ratio analysis as well:
Inflation
2